Key State
Last updated: Nov 05, 2024
Pennsylvania
Memos
The 2020 election saw a massive expansion of mail, absentee, and early in person voting. Since then, the question of whether people would continue to cast their vote prior to Election Day has remained open. While some states have rolled back eligibility for mail-in voting, Pennsylvania has continued to allow residents to request no excuse mail-in ballots. We took a look at who voted by mail or absentee ballot in 2020 and 2024.
Memo
/ November 05, 2024
In the crucial presidential swing state of Pennsylvania, voters have had the opportunity to cast mail-in ballots for over a month. This has produced an evolving body of data on voter decision-making and election performance.
In the leadup to the election, we were interested in two main timeseries: the proportion of all requested ballots that had been cast, and the party breakdown of the voters who had returned their ballots. We examined how those data evolved over the course of more than a month, as well as how they compared to the same statistics an equal number of days before the election in 2020. We noticed several patterns that shed light on both the state of the electorate and how to interpret this essential type of administrative data.
Memo
/ November 05, 2024
The 2020 presidential election in Pennsylvania saw a host of challenges presented by the pandemic coupled with a closely contested election in the state that had implications for nationwide results. Pennsylvania was one of the first states to experience the host of broader nationwide challenges of election skepticism, controversies regarding election administration, and new types of interactions between political parties and election administrators.
In the years between 2020 and 2024, Pennsylvania has been the site of several legal battles with important consequences for the state’s election administration, especially in the realm of voting by mail and other methods that became popular and widespread after the pandemic. Data from the 2024 primary demonstrates Pennsylvania’s continued use of mail-in voting years after the pandemic, while voter registration data reflects changes in the state’s electorate, including the implementation of Automatic Voter Registration (AVR). As election administrators look toward the 2024 general election, this report analyzes some of the administrative and legal issues that will continue to shape the election landscape in Pennsylvania and the nation.
Memo
/ September 12, 2024
State Resources
Data Visualizations
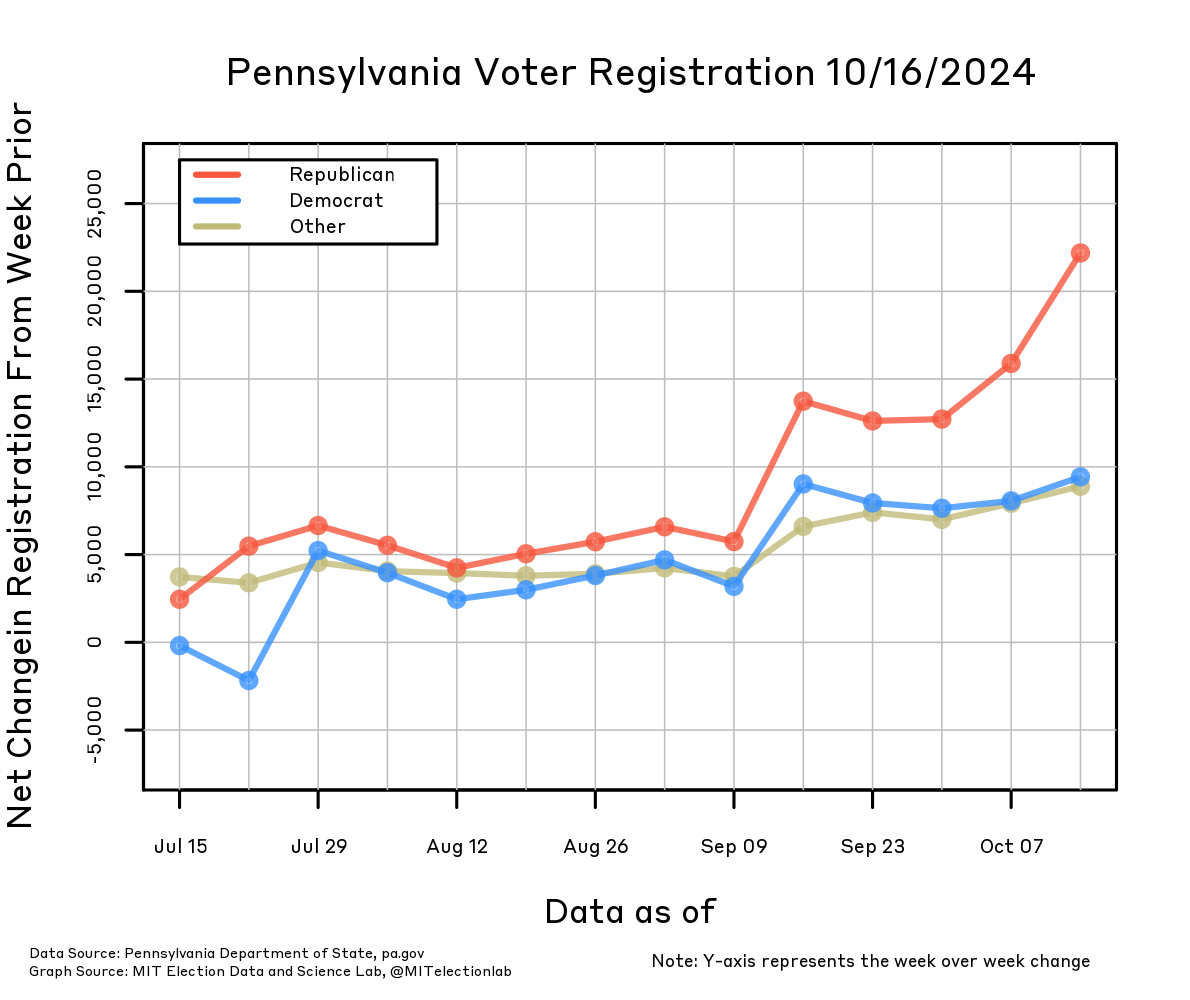
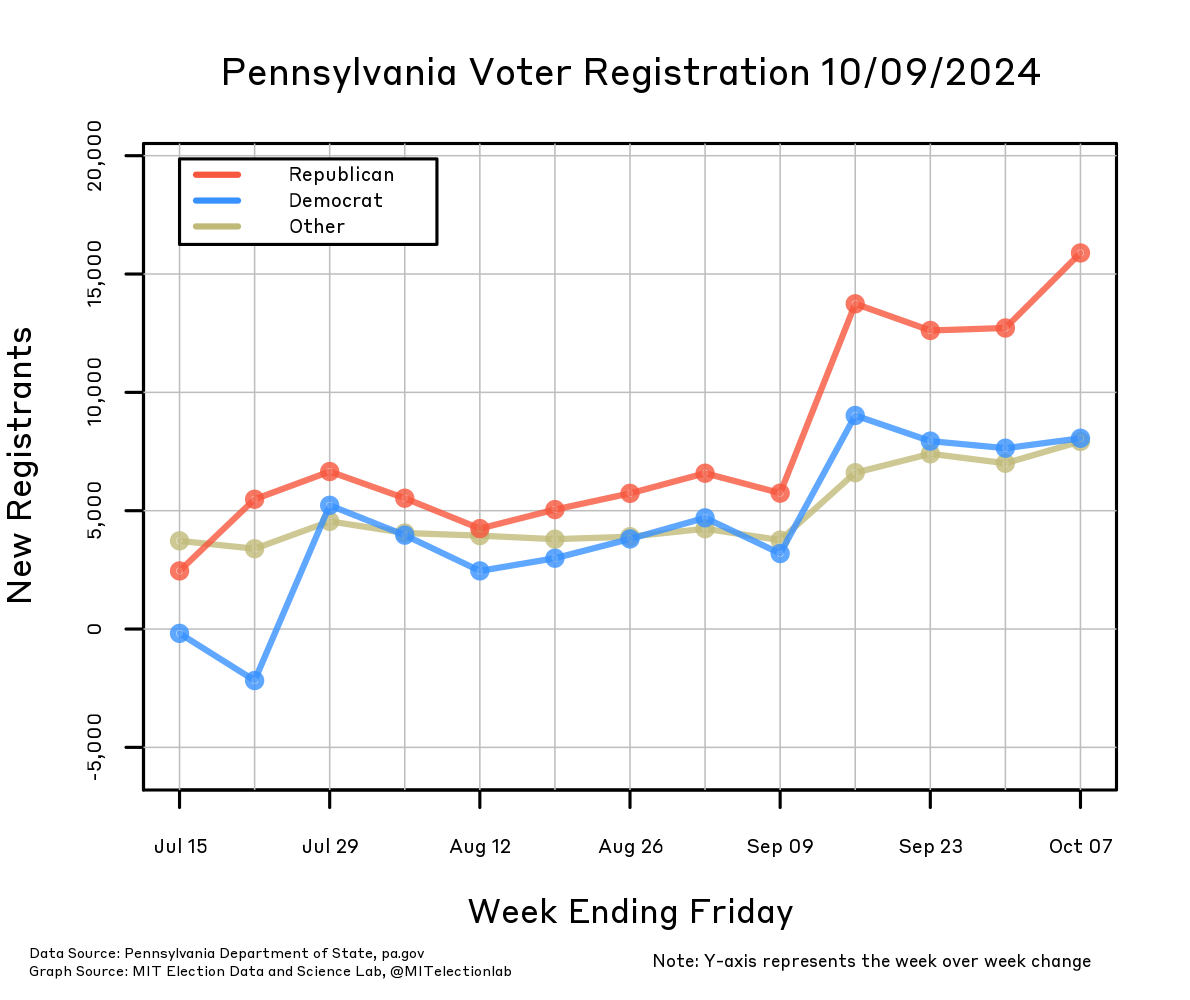
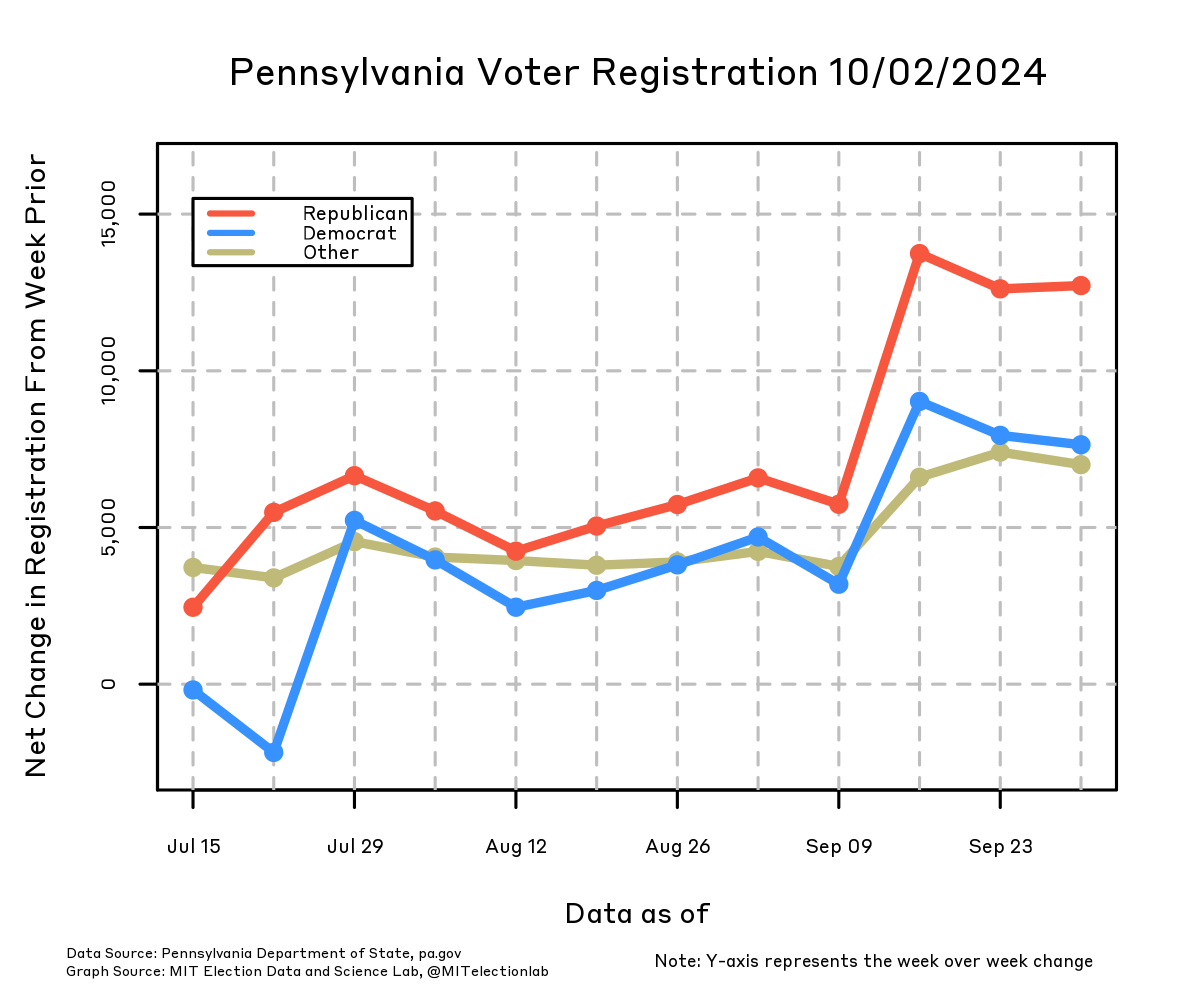
Voter Registration
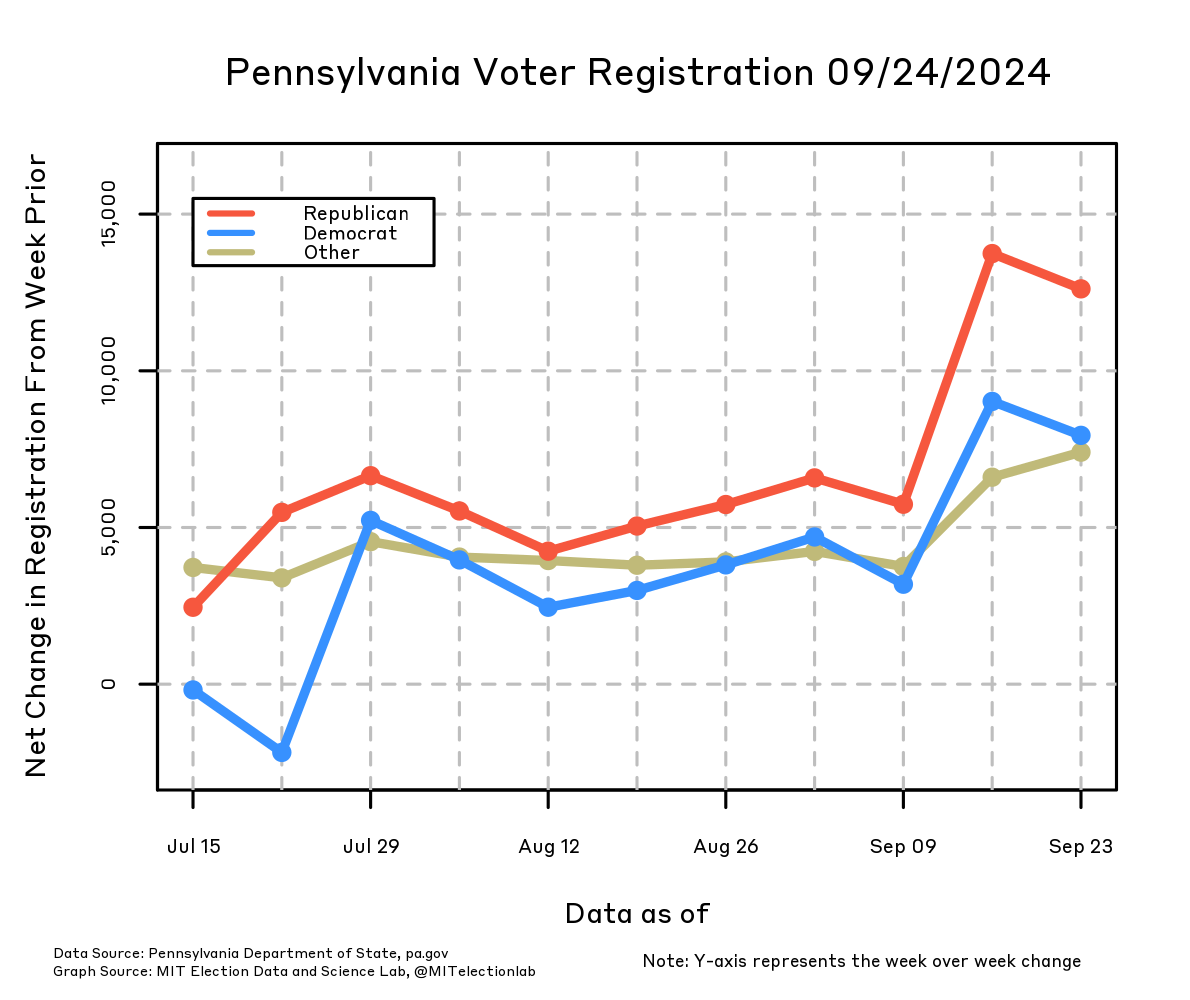
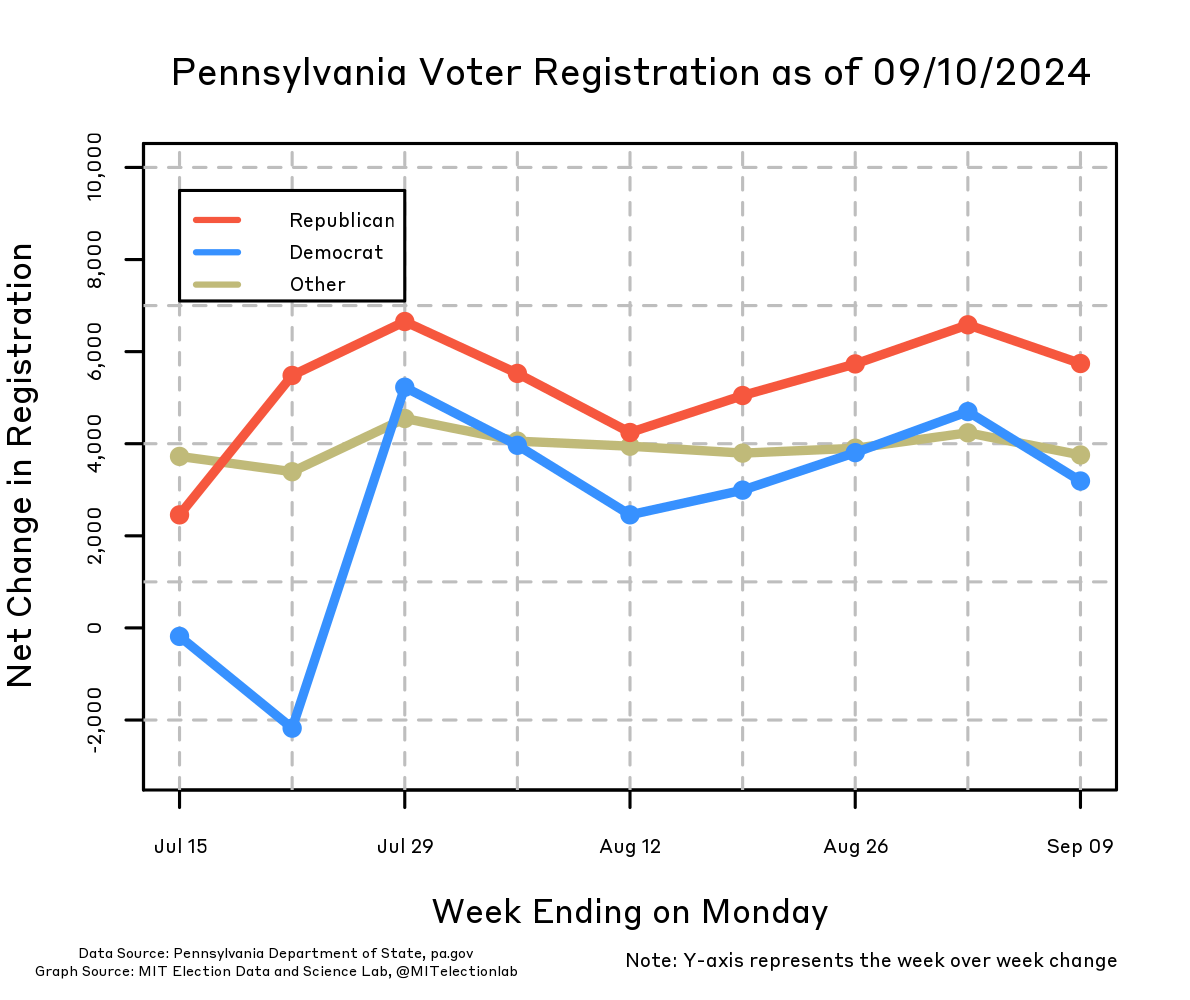
These plots show the week-by-week change in the total number of registered voters in Pennsylvania, with voters split into three categories: registered Republicans, registered Democrats, and all other registered voters.
The data are acquired from the Secretary of State's office at this website (as of September 10, 2024, they are obtained by clicking on the link "Voter registration statistics by county"). The date that the data were last updated is displayed at the top of the first sheet of the file, and the timestamps indicate that they are updated every Monday.
We compute the net change from one week to the next by subtracting the number of registered voters of a given party in that week from the number of registered voters of that party in the previous week's file. Voters affiliated with another party or no party are combined into our Other category.
The net change that we plot is distinct from the number of new registrants of a given party. Those two numbers can appear substantively different: for example, if more Democrats register than Republicans in a given week, while in the same week more Pennsylvanians cease being registered Democrats than registered Republicans, then the net change would appear different from the raw number of new registrants. When Democrats experience a greater net decrease or a smaller net increase than Republicans, it may partly be attributable to the larger number of Democrats in Pennsylvania overall, but measuring the differential rate in attrition between registered voters of the two parties would require individual-level data; for example, from the Pennsylvania voter file.
Last updated: October 9, 2024
October 9, 2024
October 2, 2024
September 24, 2024
September 10, 2024
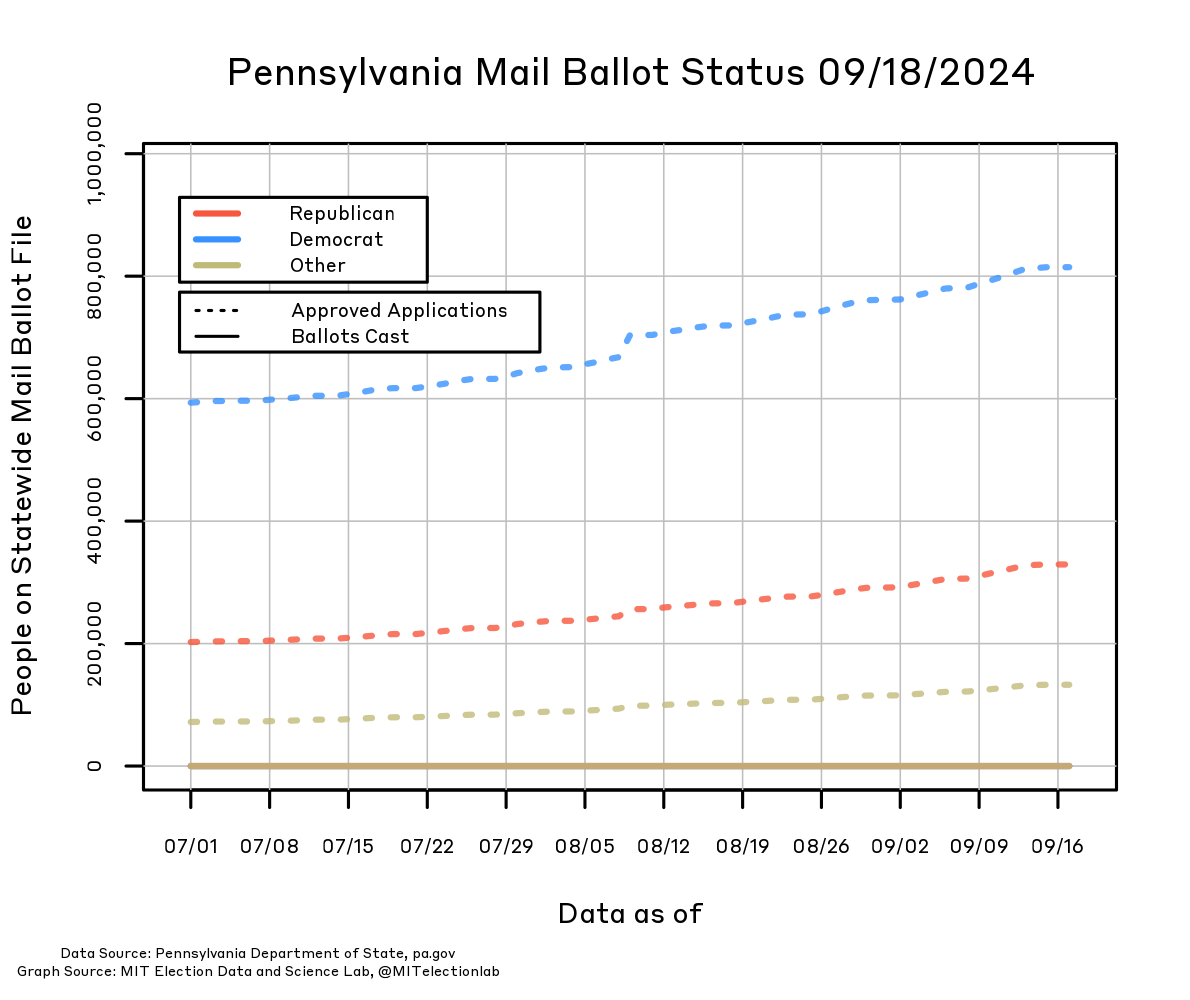
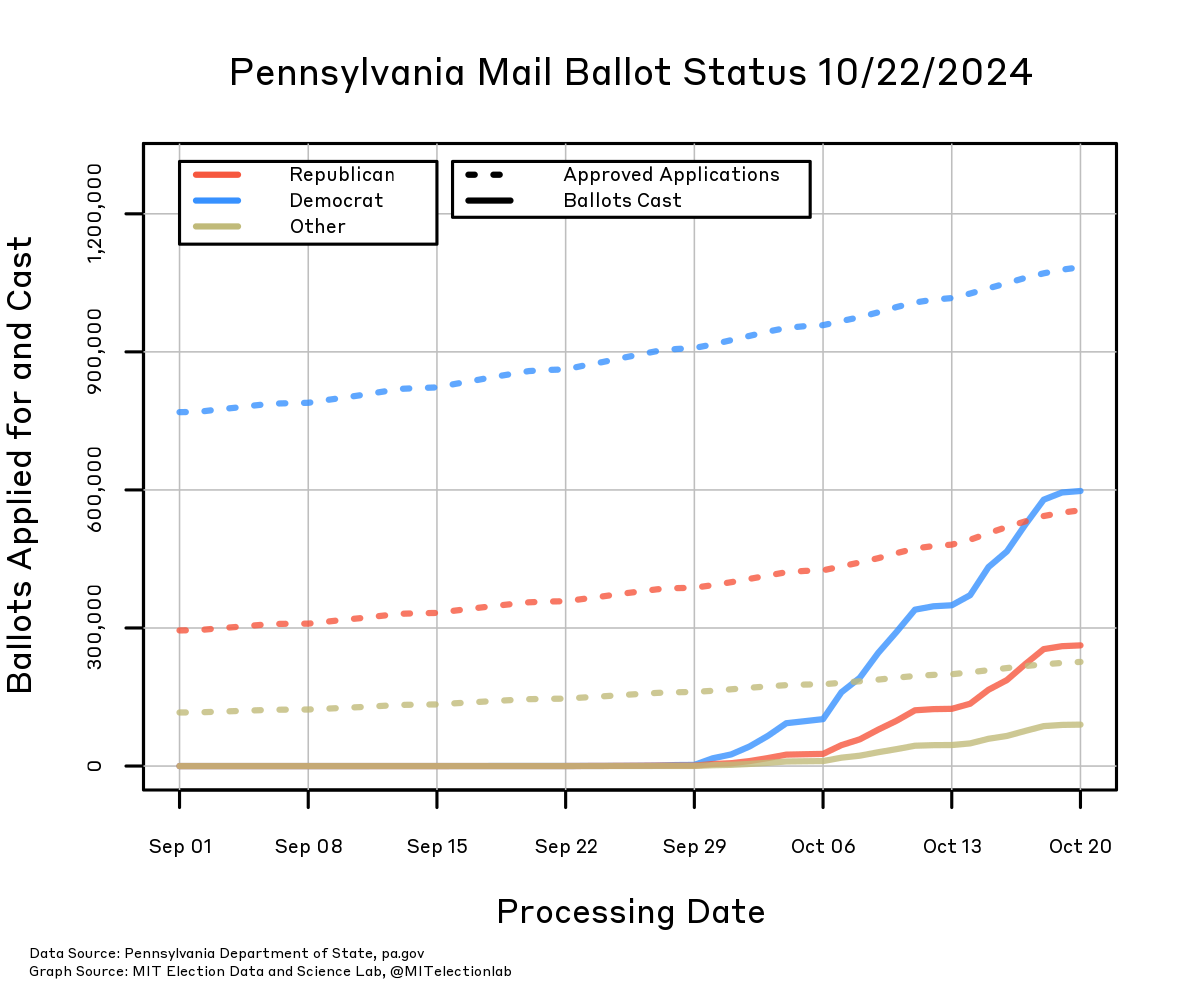
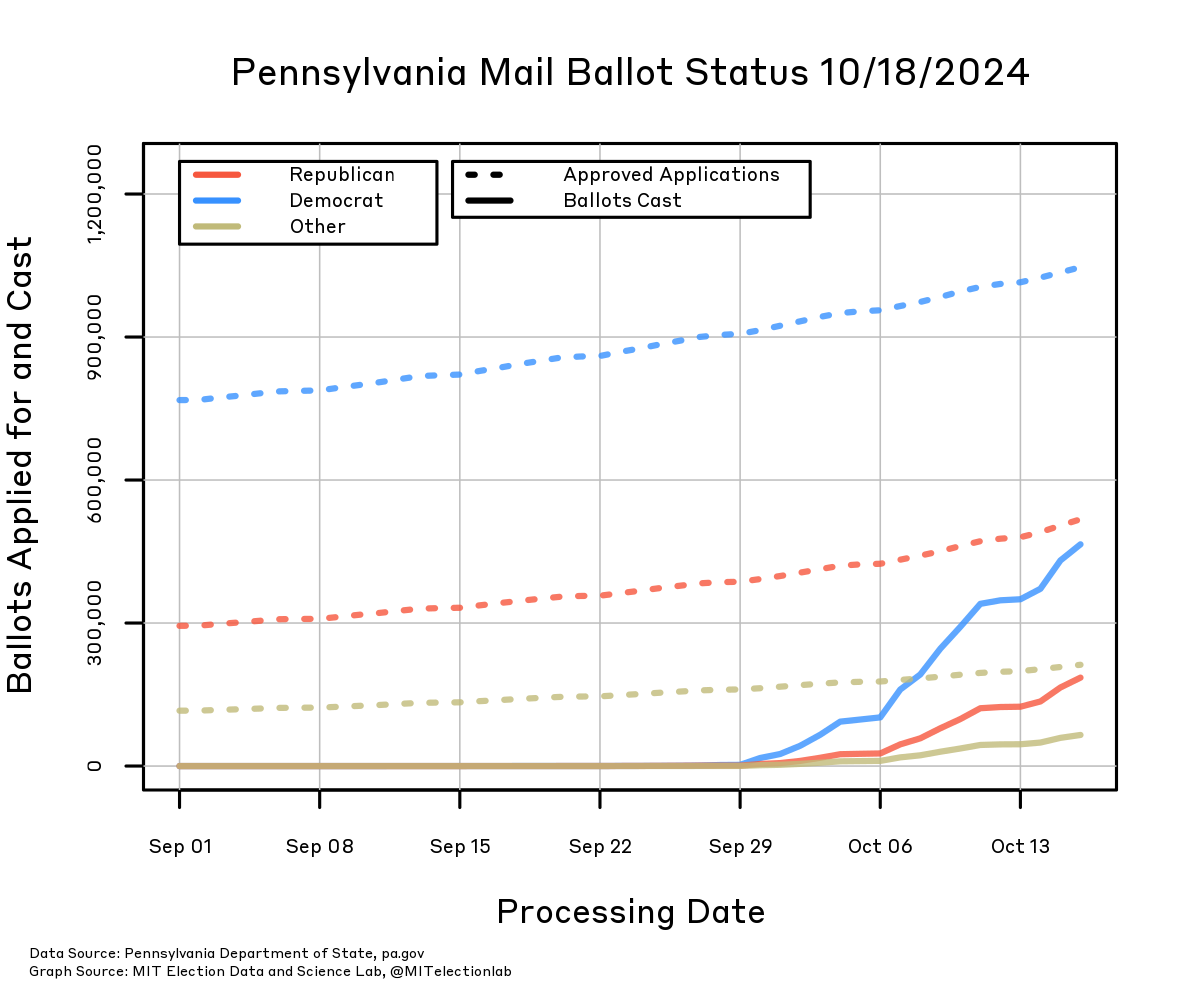
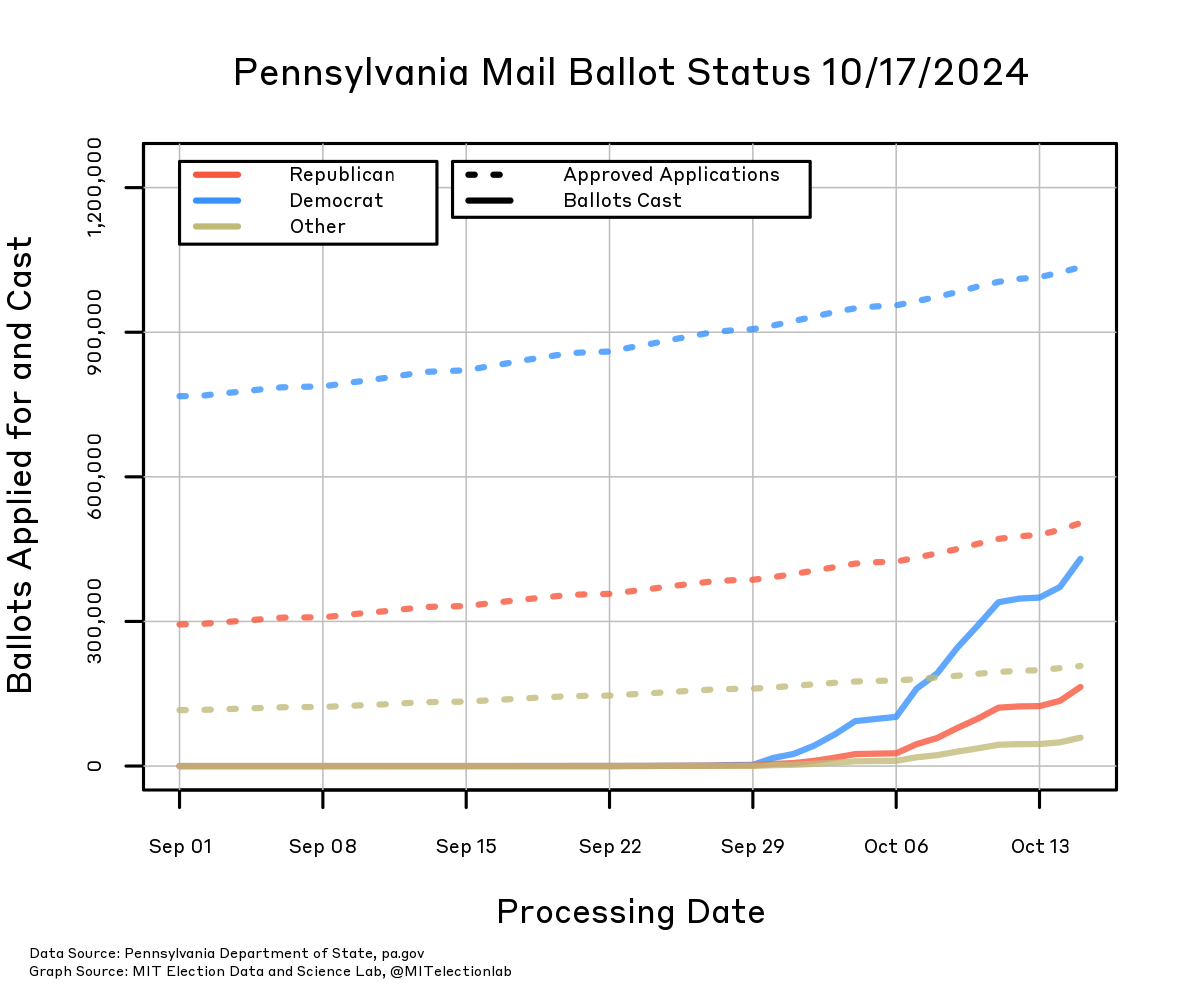
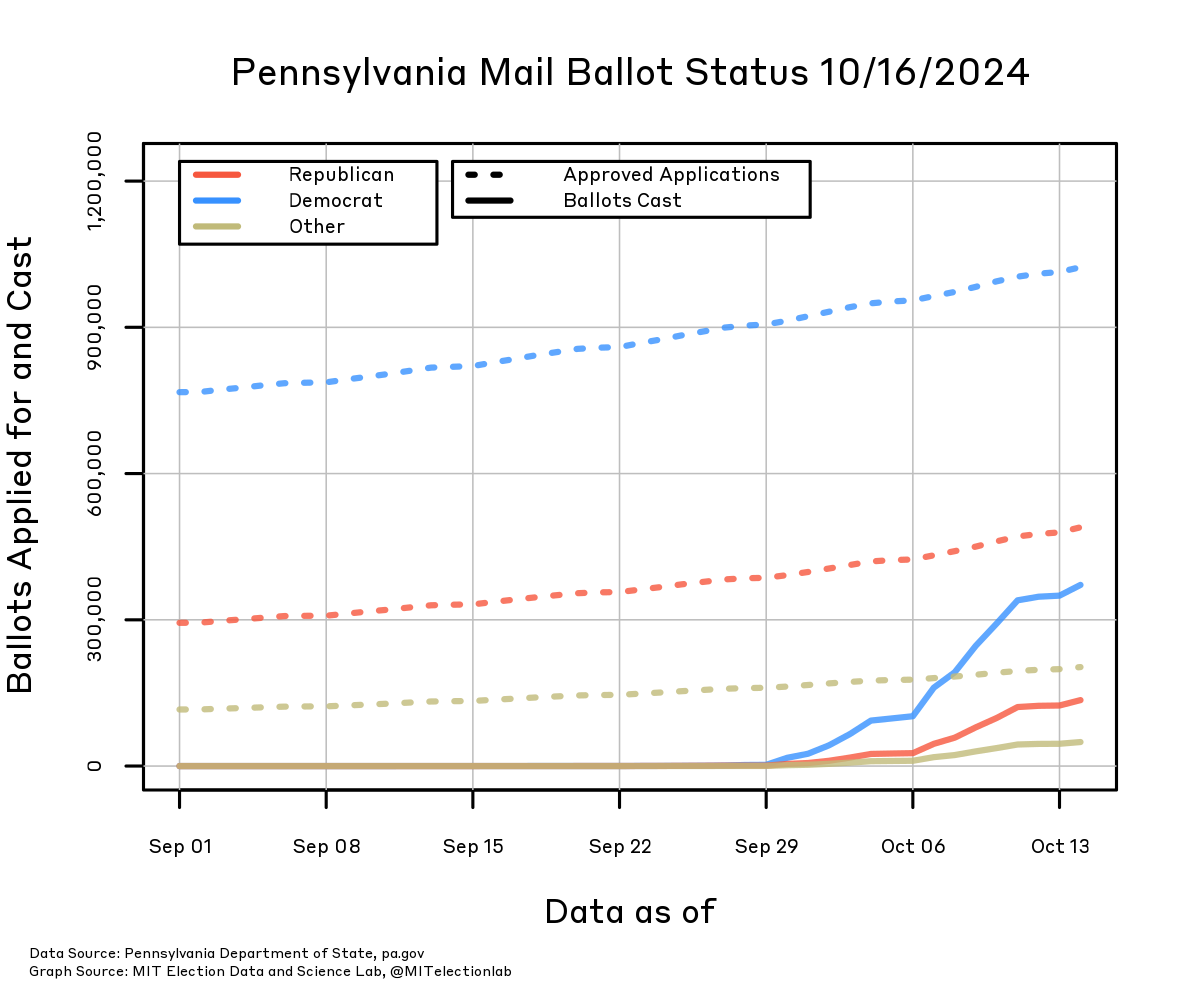
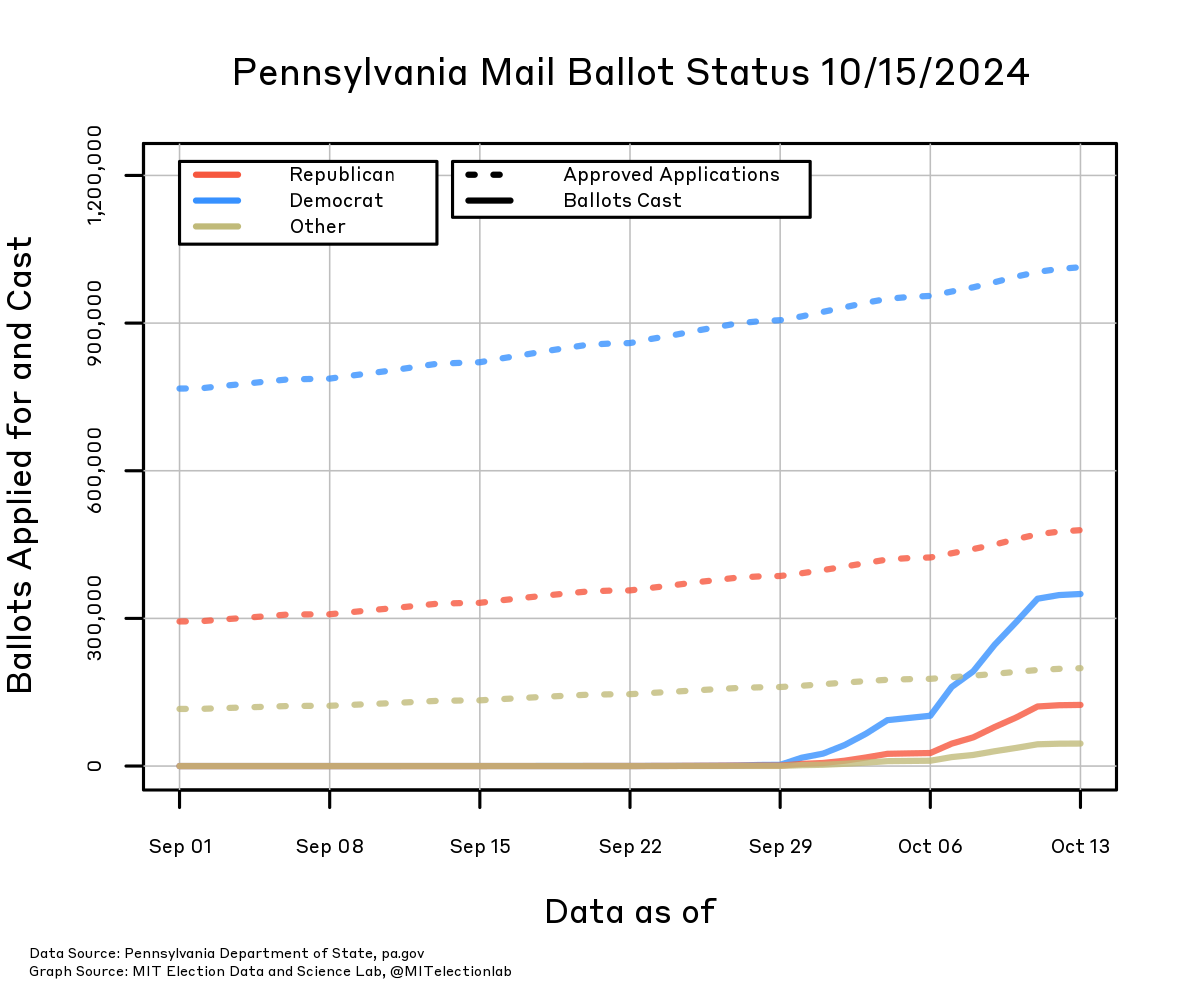
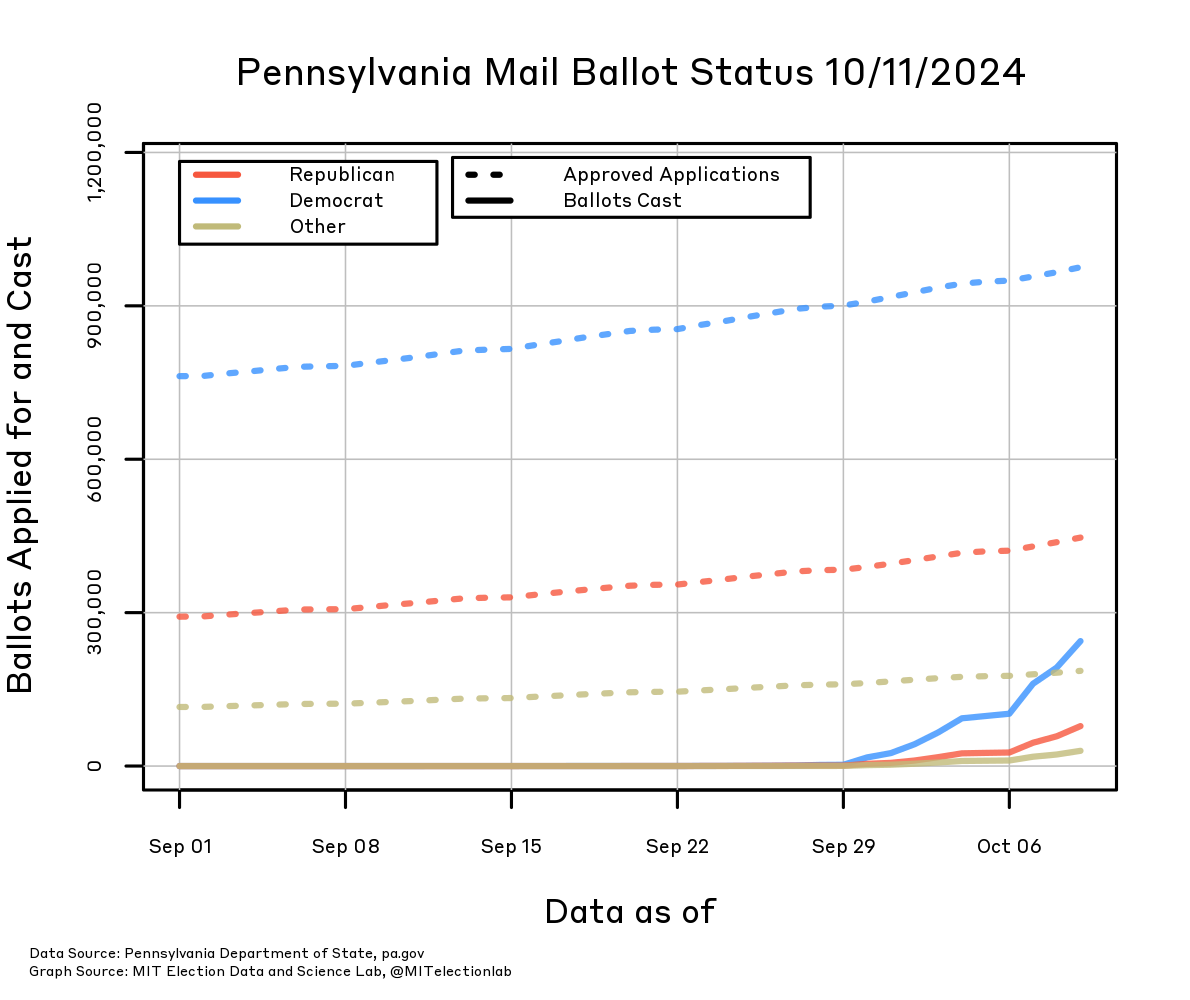
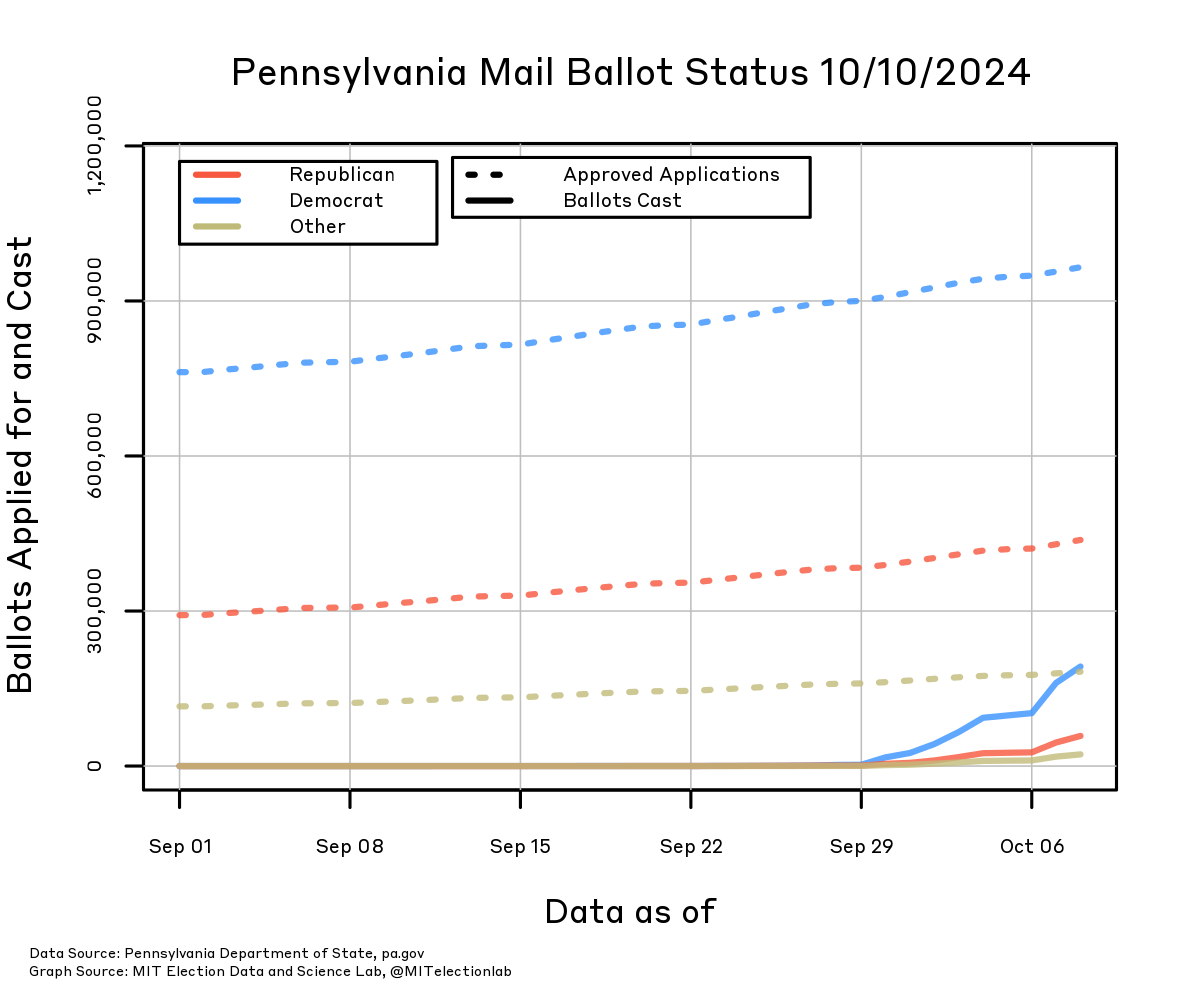
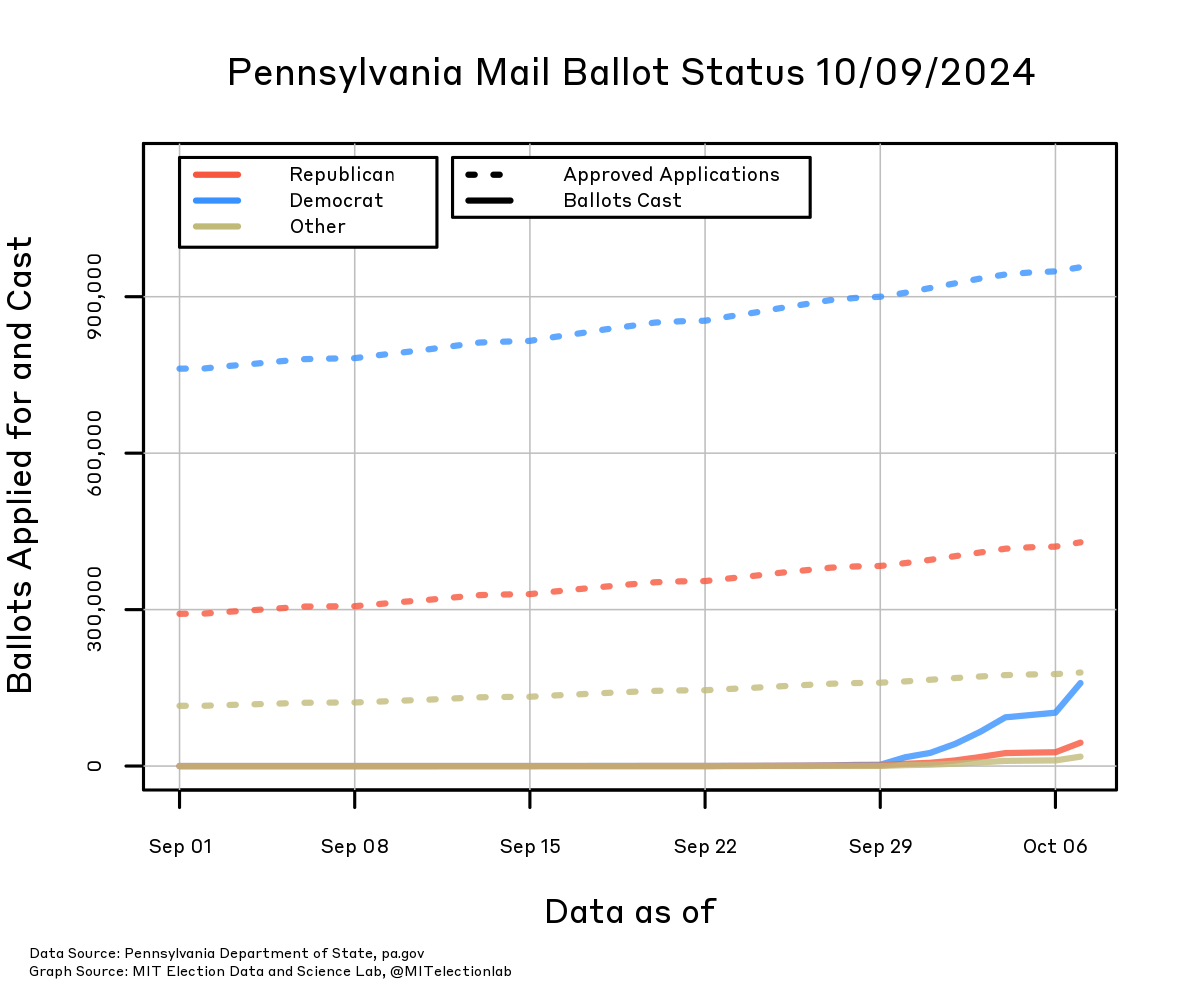
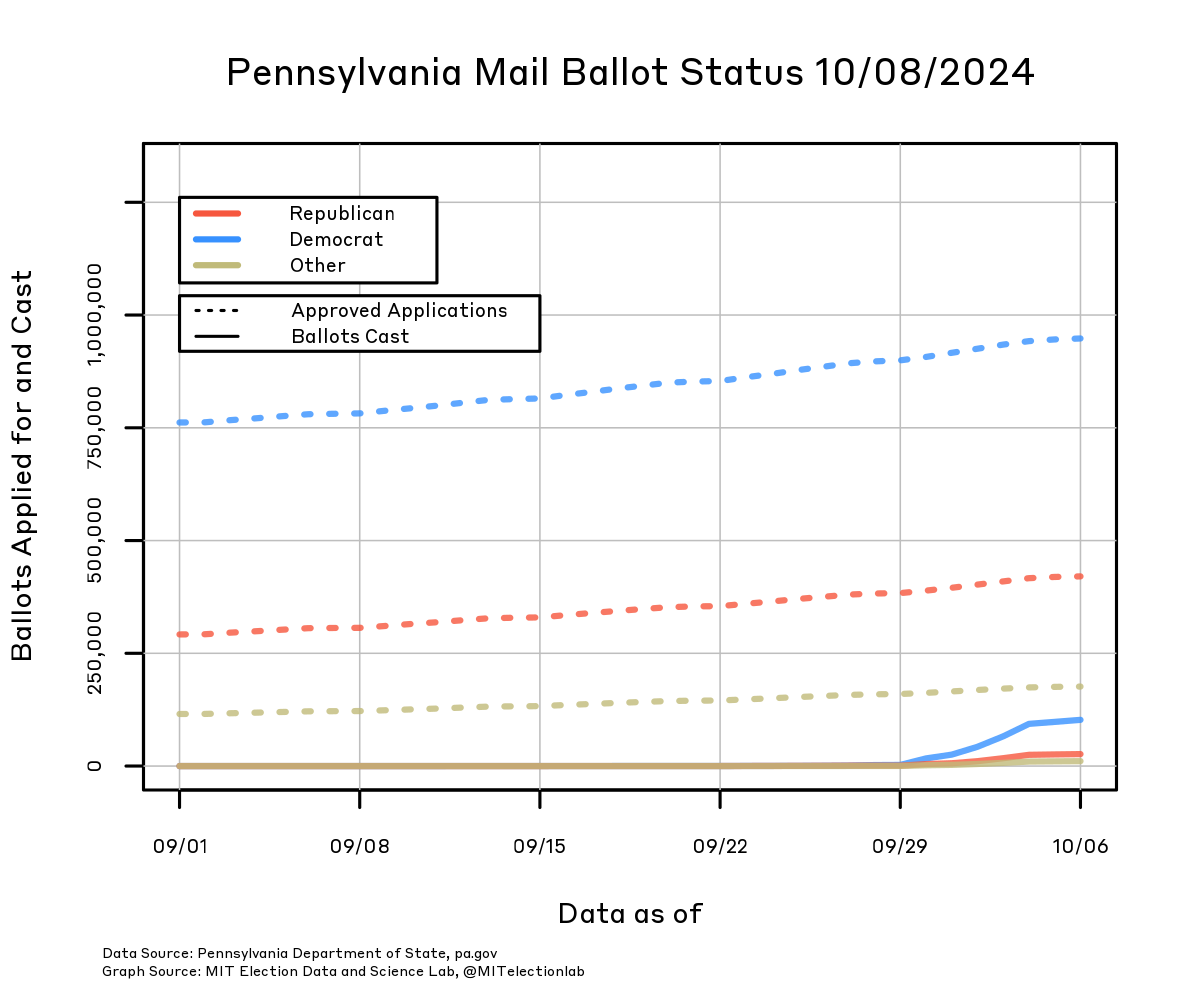
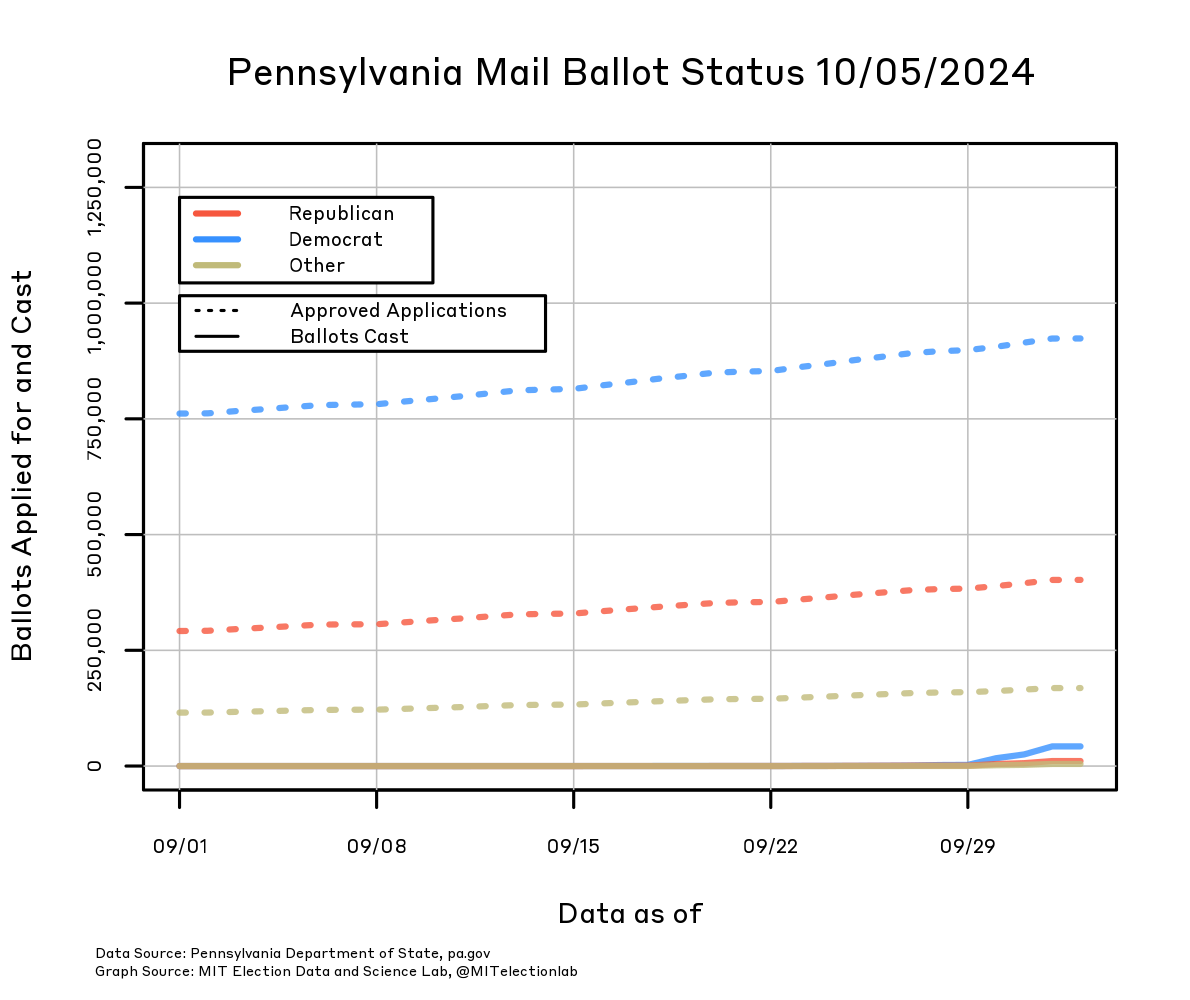
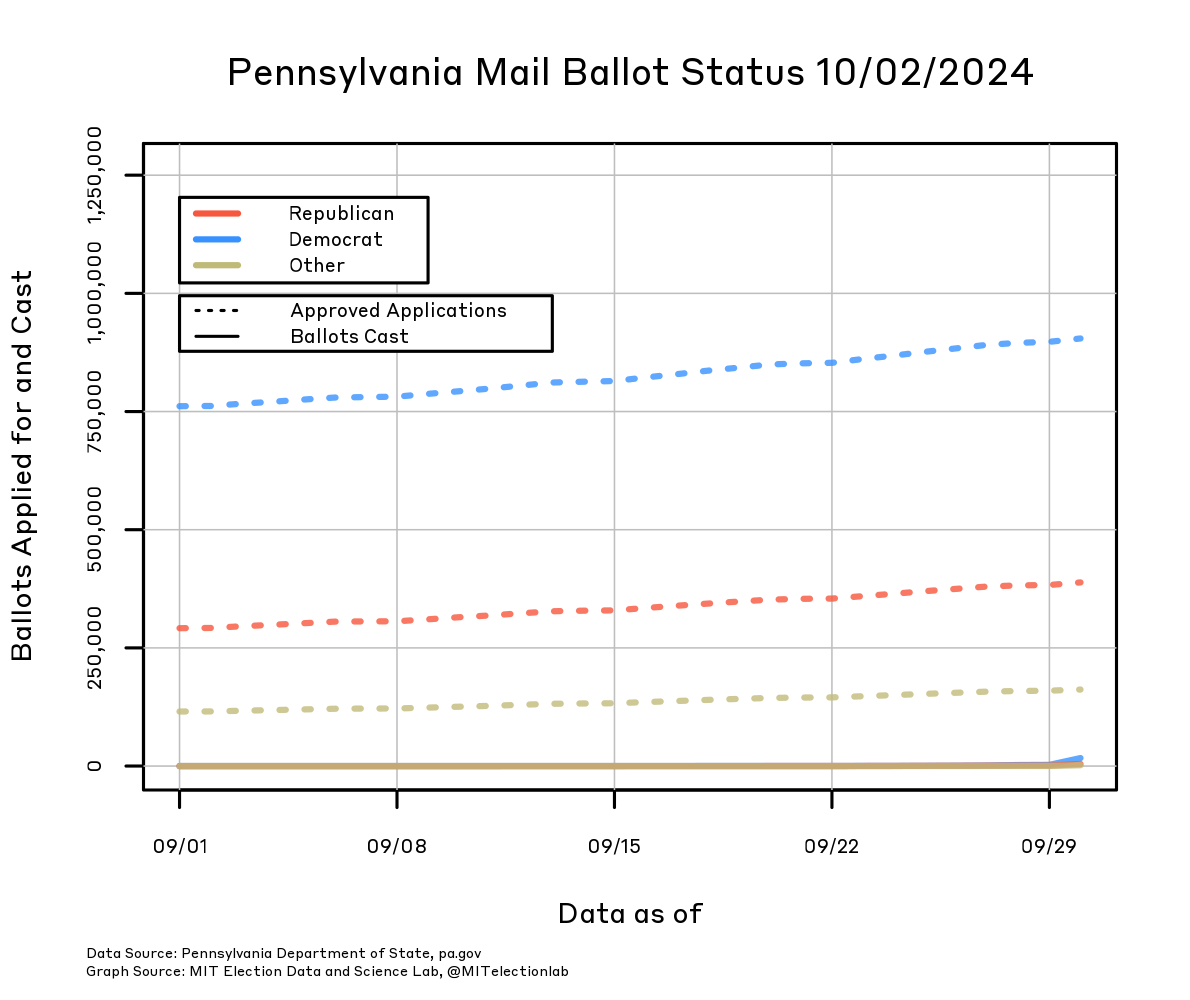
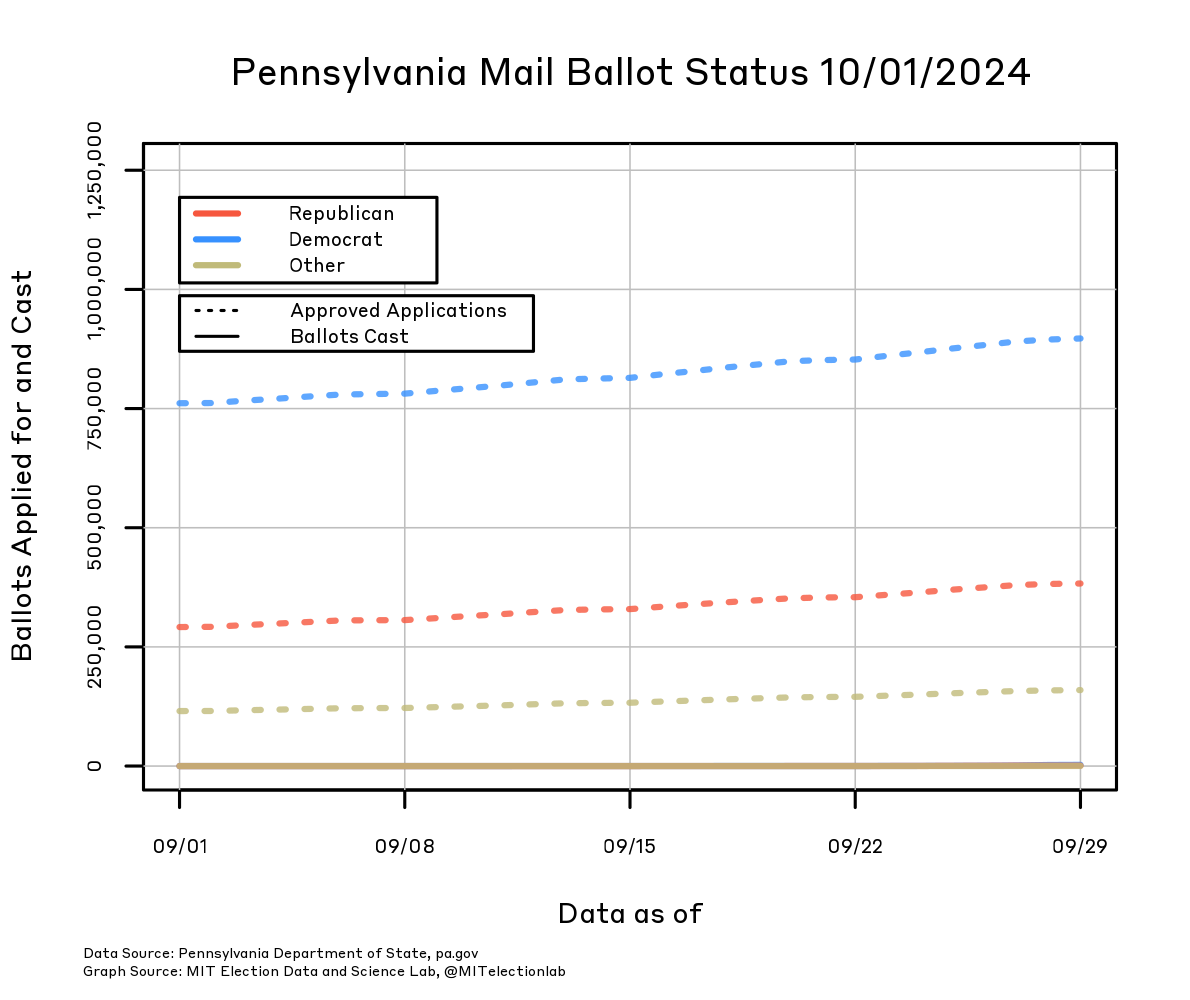
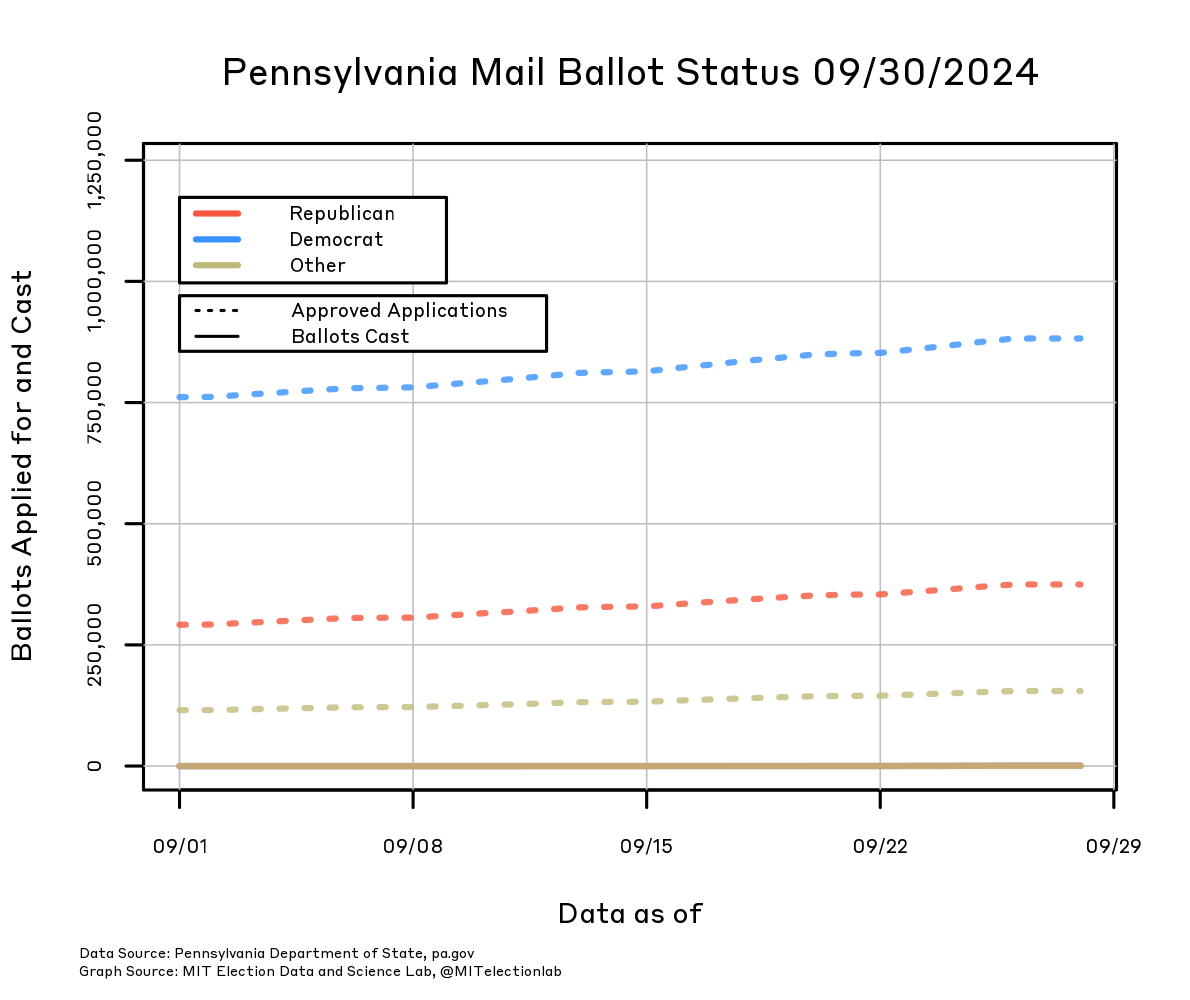
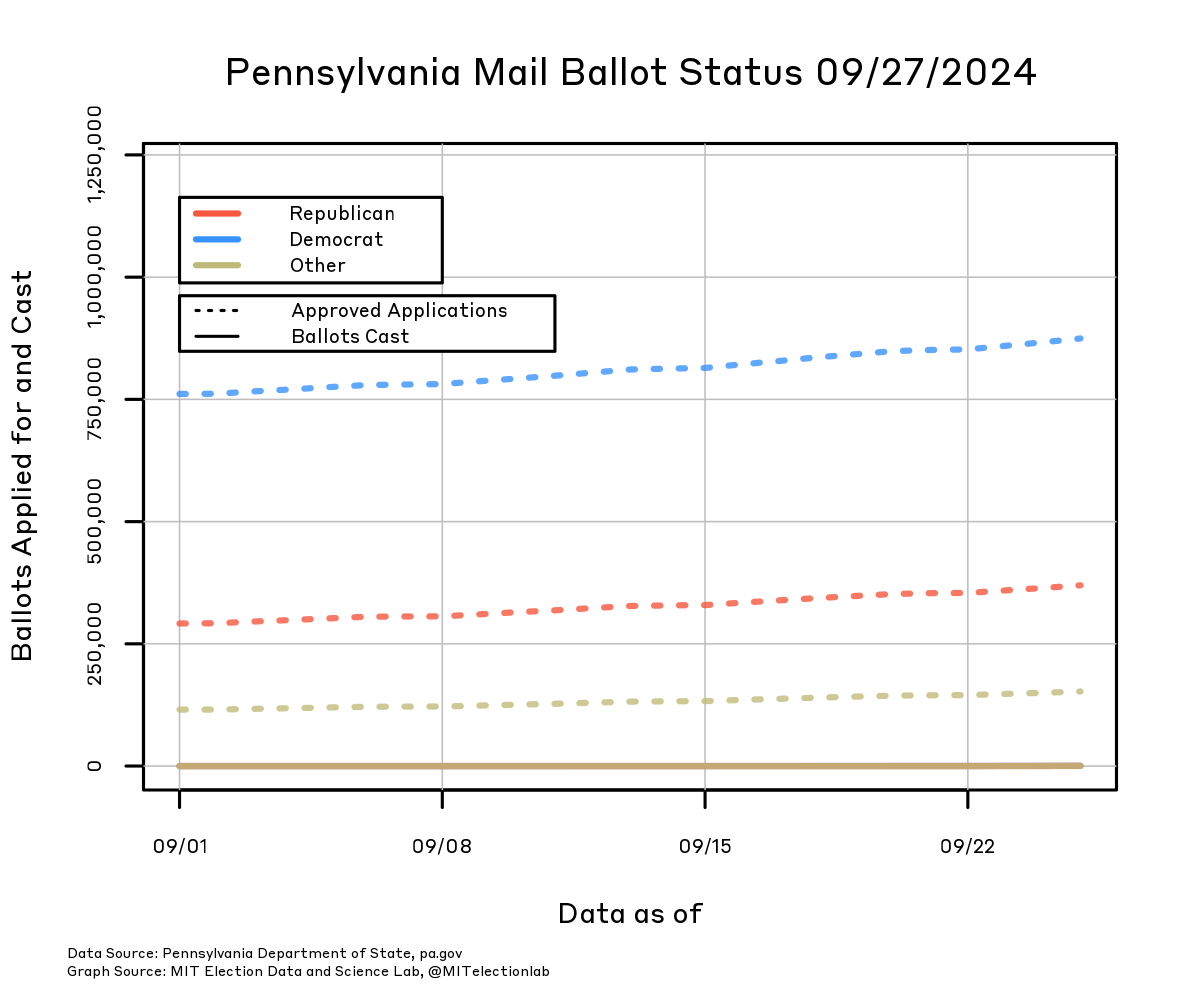
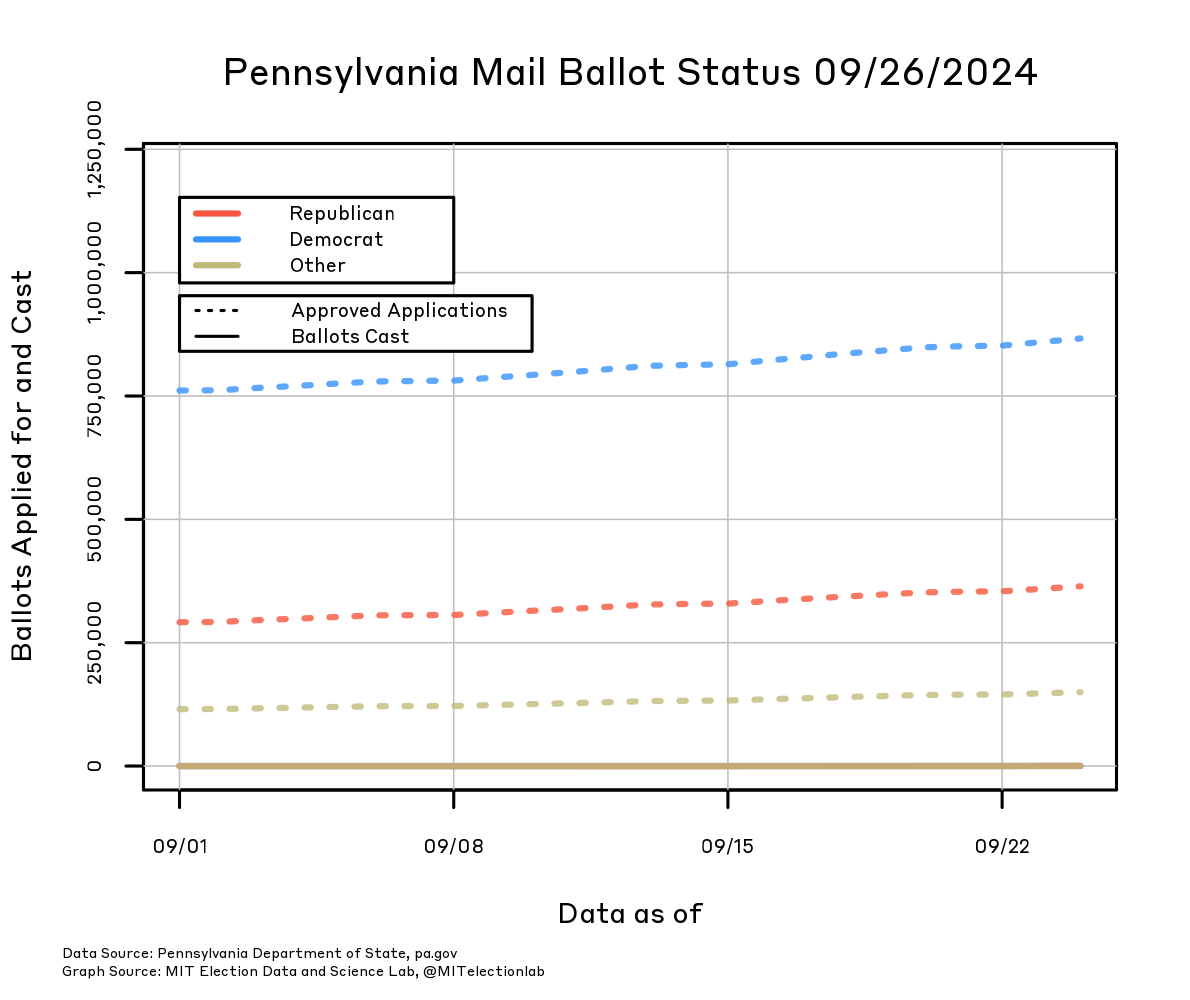
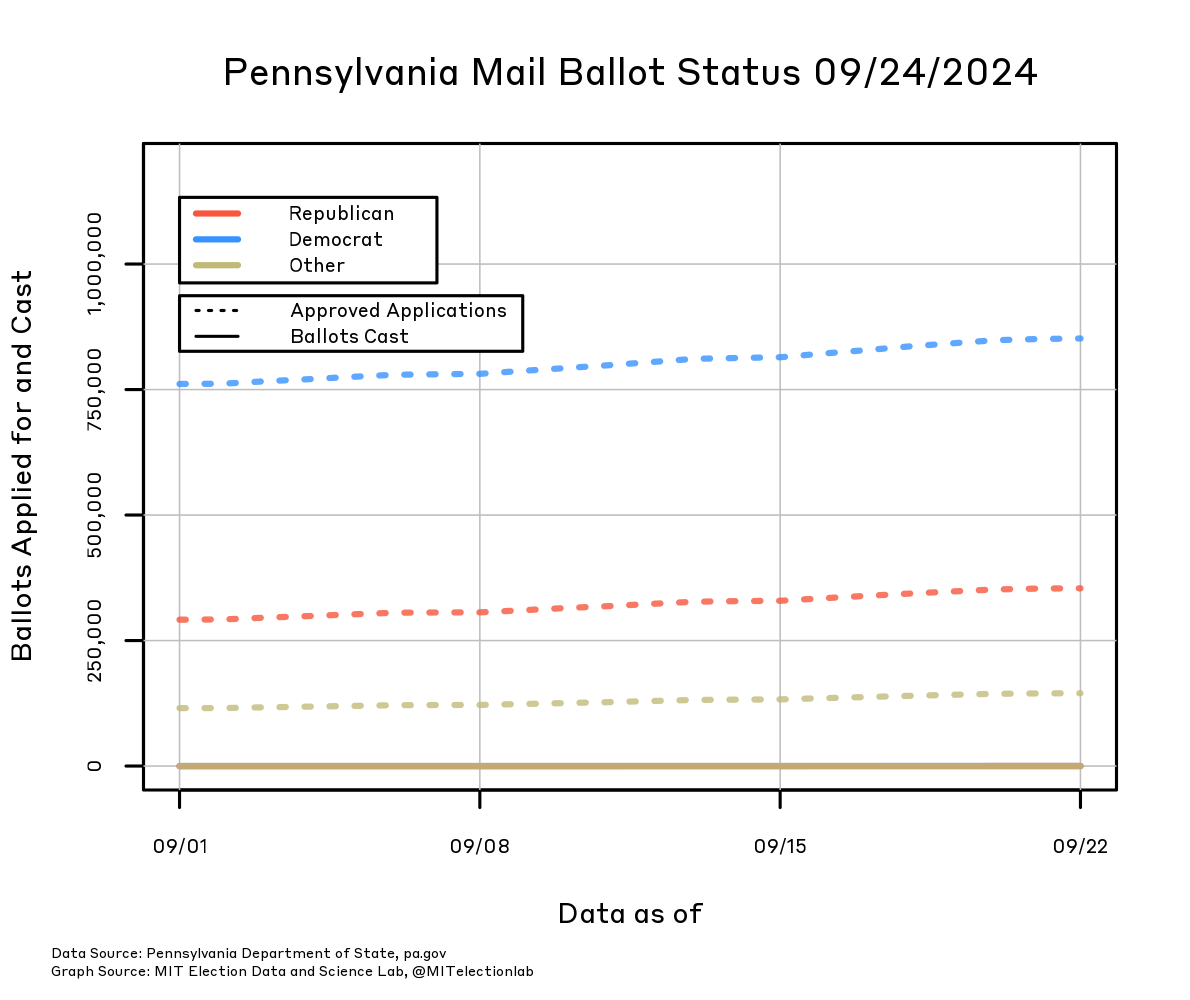
Mail Ballot Status
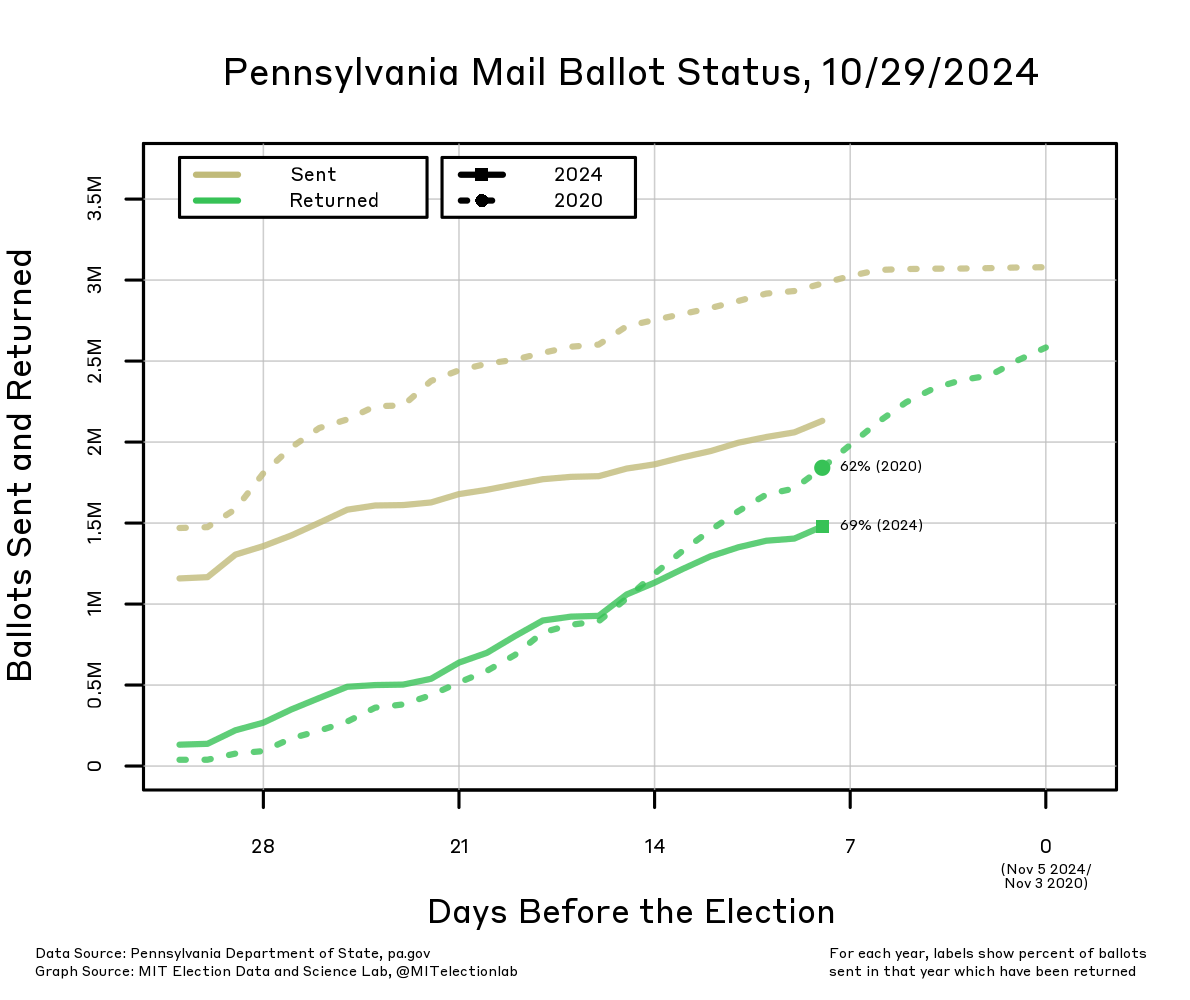
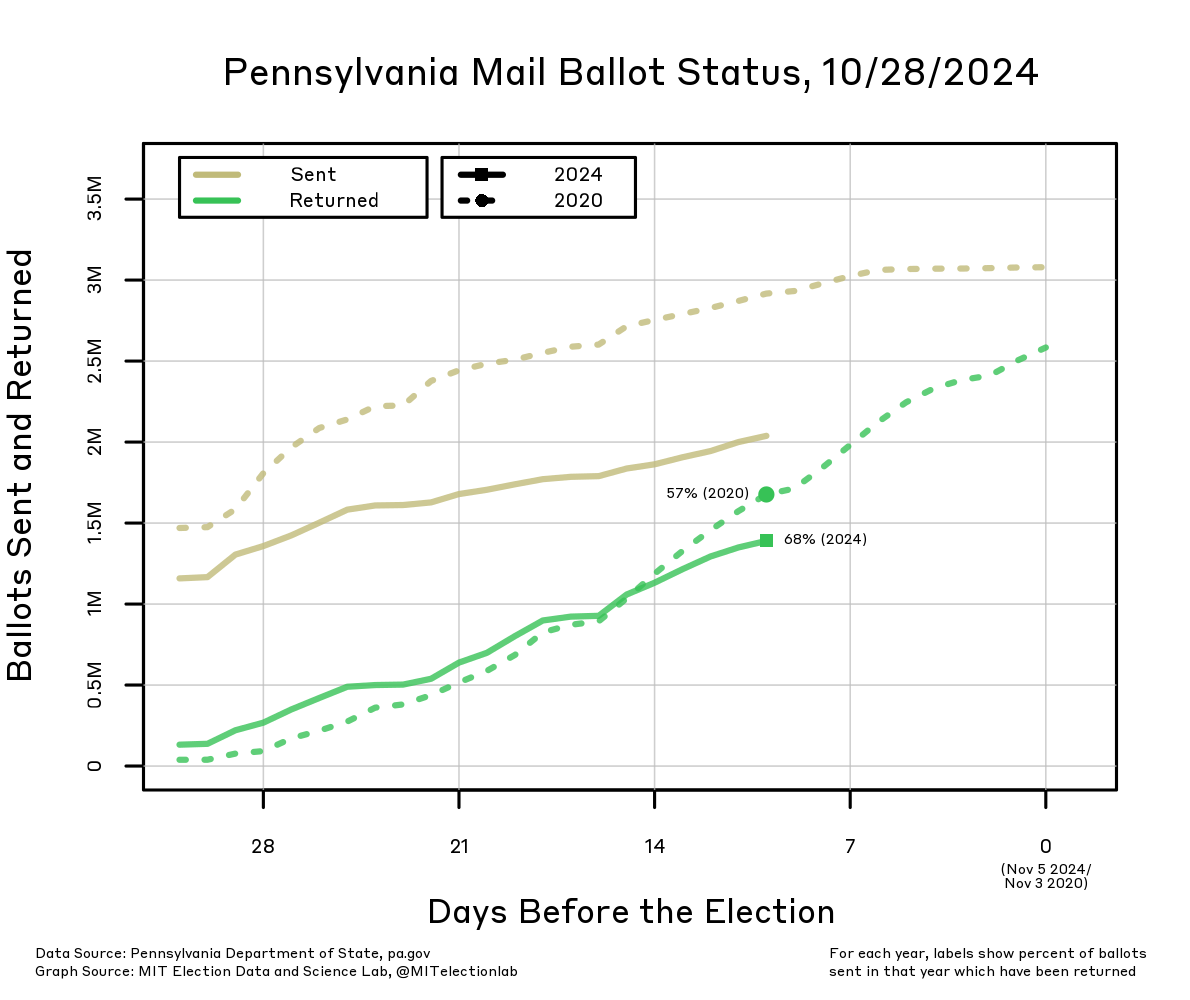
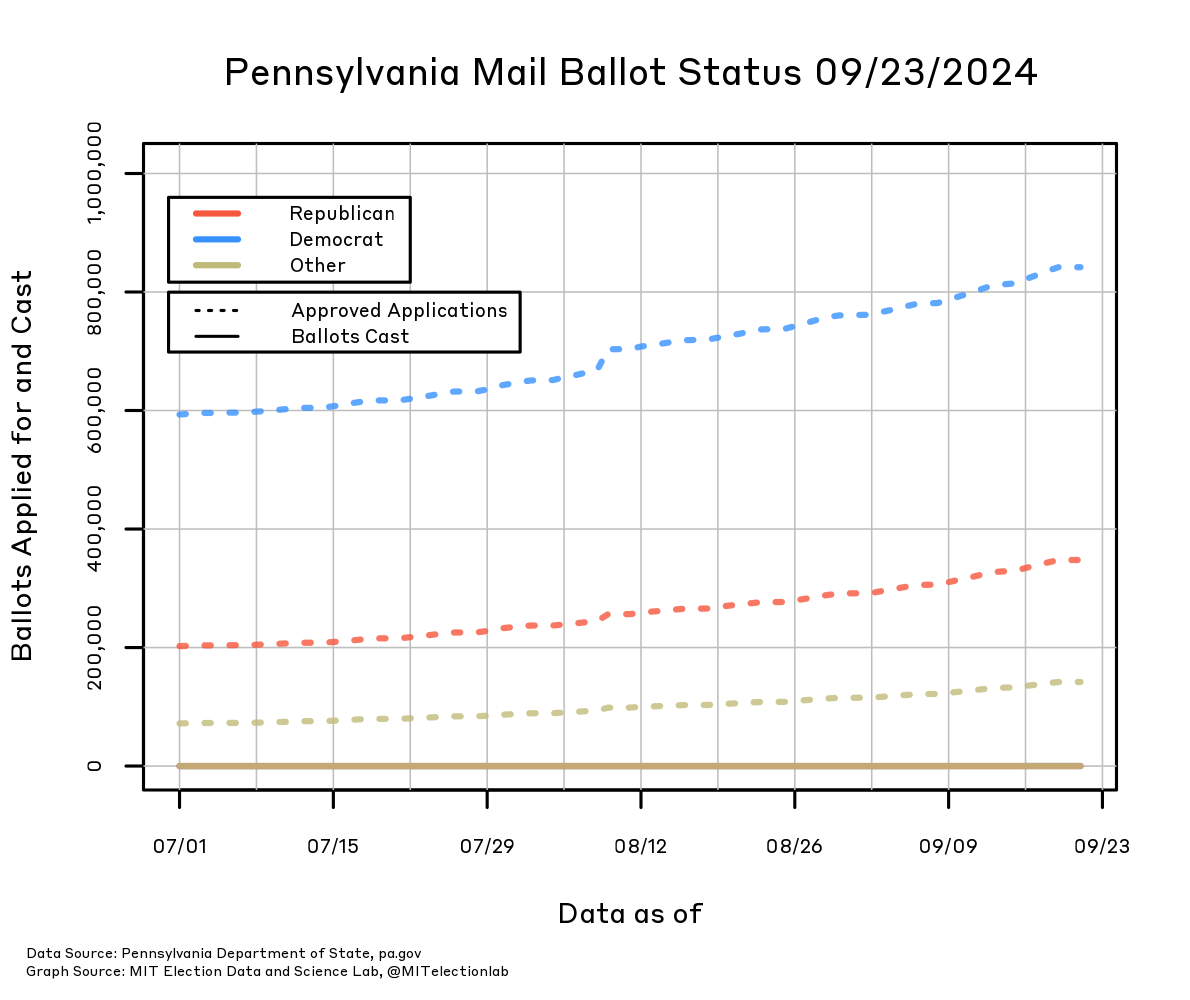
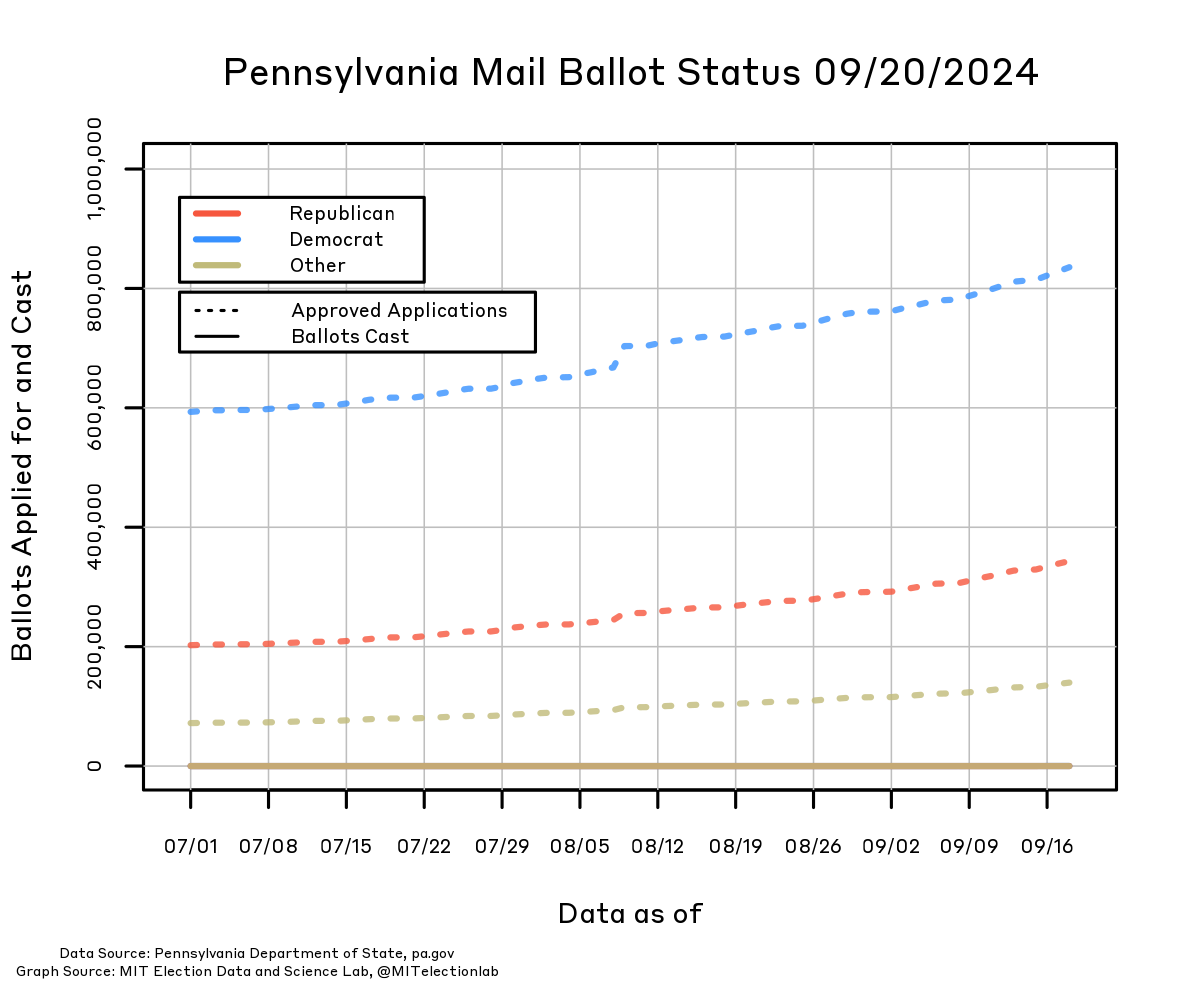
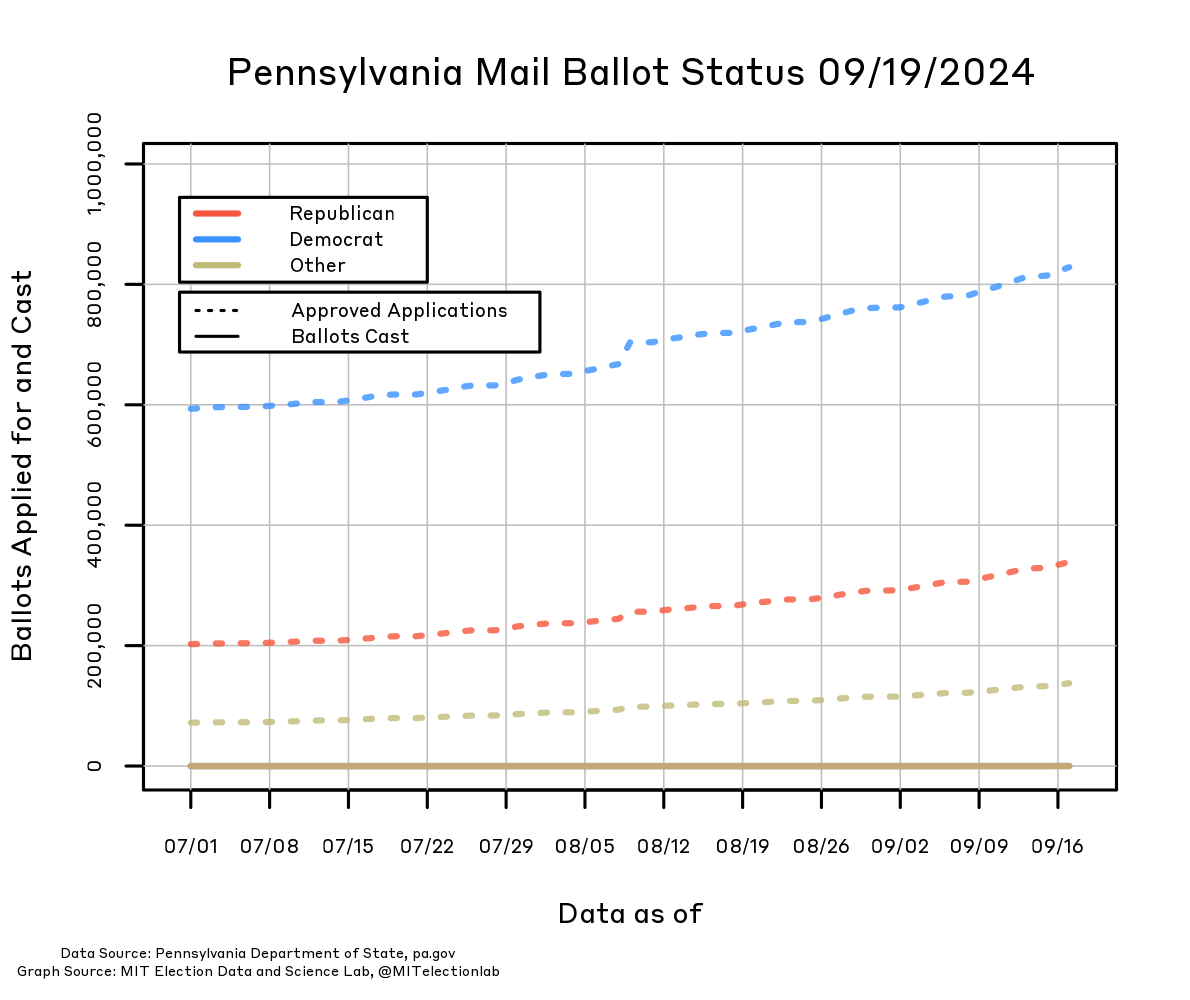
This plot describes the number of mail-in ballot applications approved in Pennsylvania, and the number of ballots that have been cast. The Pennsylvania Department of State maintains a Statewide Mail Ballot File that voters may opt into in order to receive a mail-in ballot. The File lists every application for a mail ballot, whether or not that application was approved, and whether the voter who made the application has returned their ballot.
To compute the number of Approved Applications, we use the Statewide Mail Ballot File, as of the date that we generate the plot. We subset the Mail Ballot File to only approved applications, and we count the cumulative number of applications that had been approved on or before a given day. To compute the number of Ballots Cast, we sum the cumulative number of ballots in the Statewide Mail Ballot File that are marked as having been returned by that day. Every day we update the plot up to the day before the file was released, so that we are always reporting on a day that has already finished. For example, suppose that at 9 AM on a Friday we update our script using a file that was last updated by the Pennsylvania Department of State at noon on Thursday; then Wednesday would have been the last complete day of applications logged in the file.
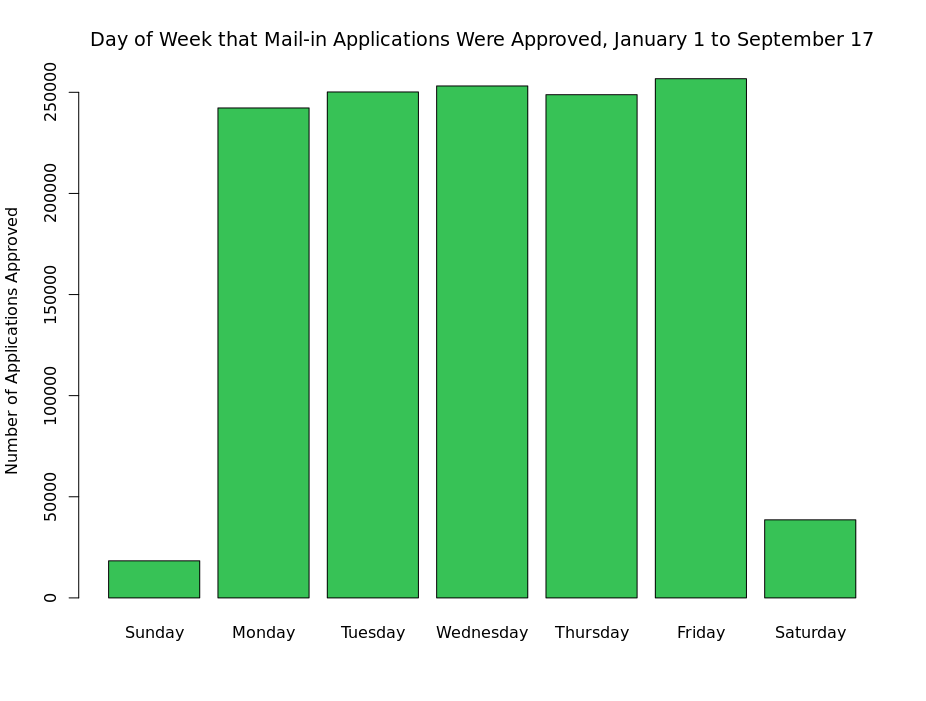
Note that there are strong periodic effects in when mail ballot applications are processed. Each curve representing Approved Applications periodically flattens for a few days, then increases, then flattens, and so on. This is a result of applications tending to be processed more on some days of the week than others. The figure below shows the number of applications approved by day of the week since January 1; while there is little evident connection between weekdays and the number of approved applications, very few approved applications are dated to either Saturday or Sunday. The minimal changes on these days together causes the periodic flattenings visible on our daily plots.
Last updated: November 5, 2024
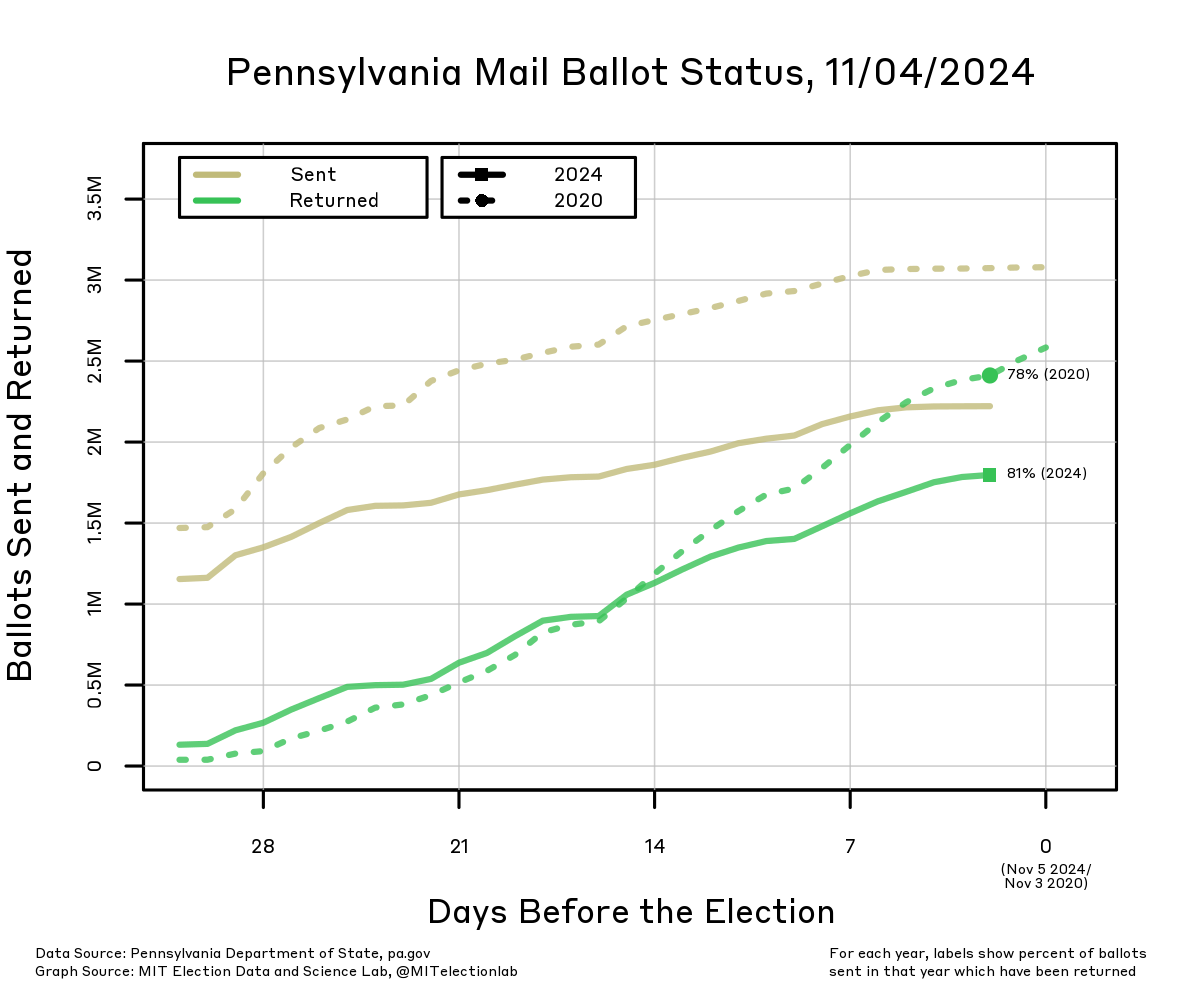
Ballots sent and returned:
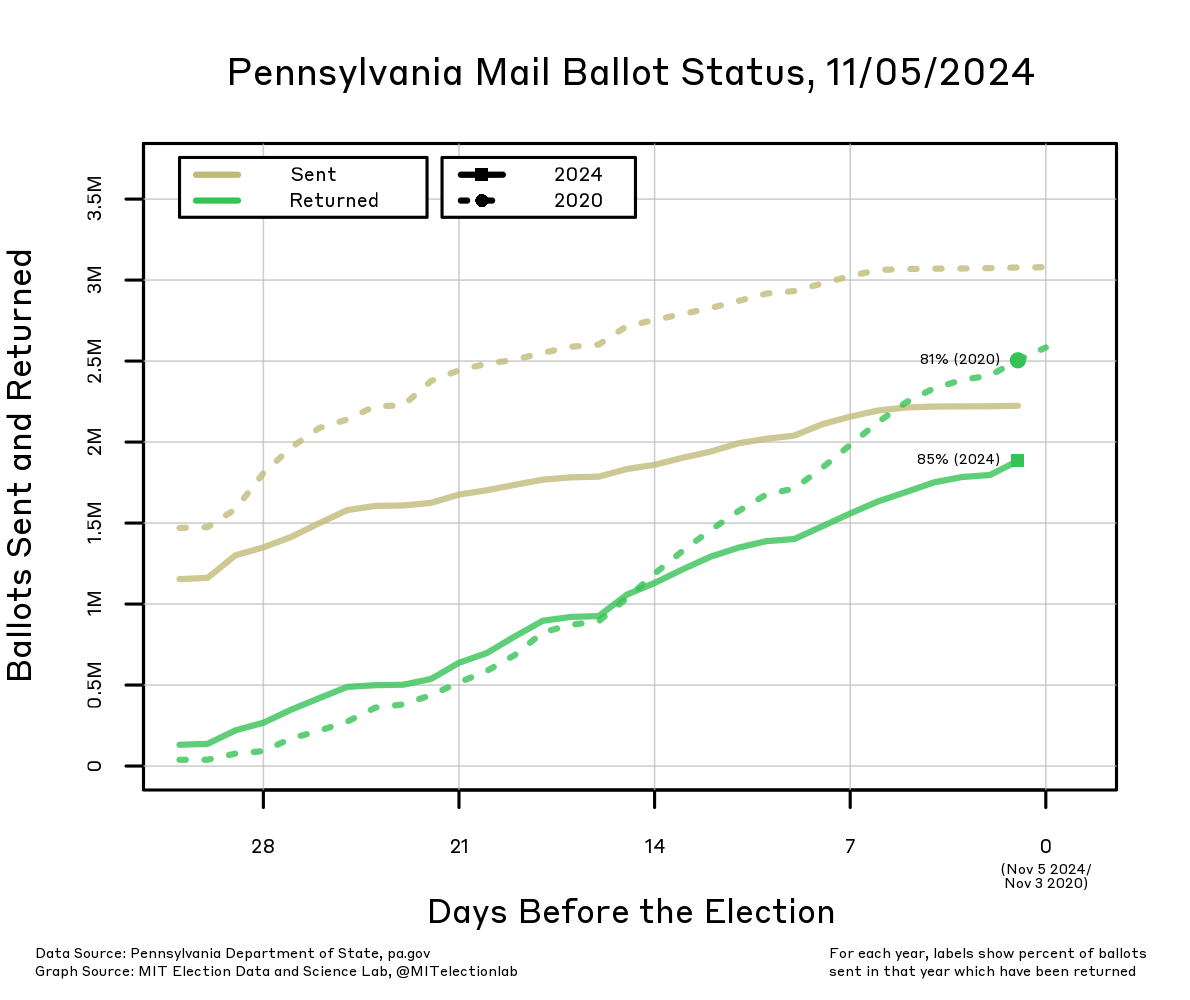
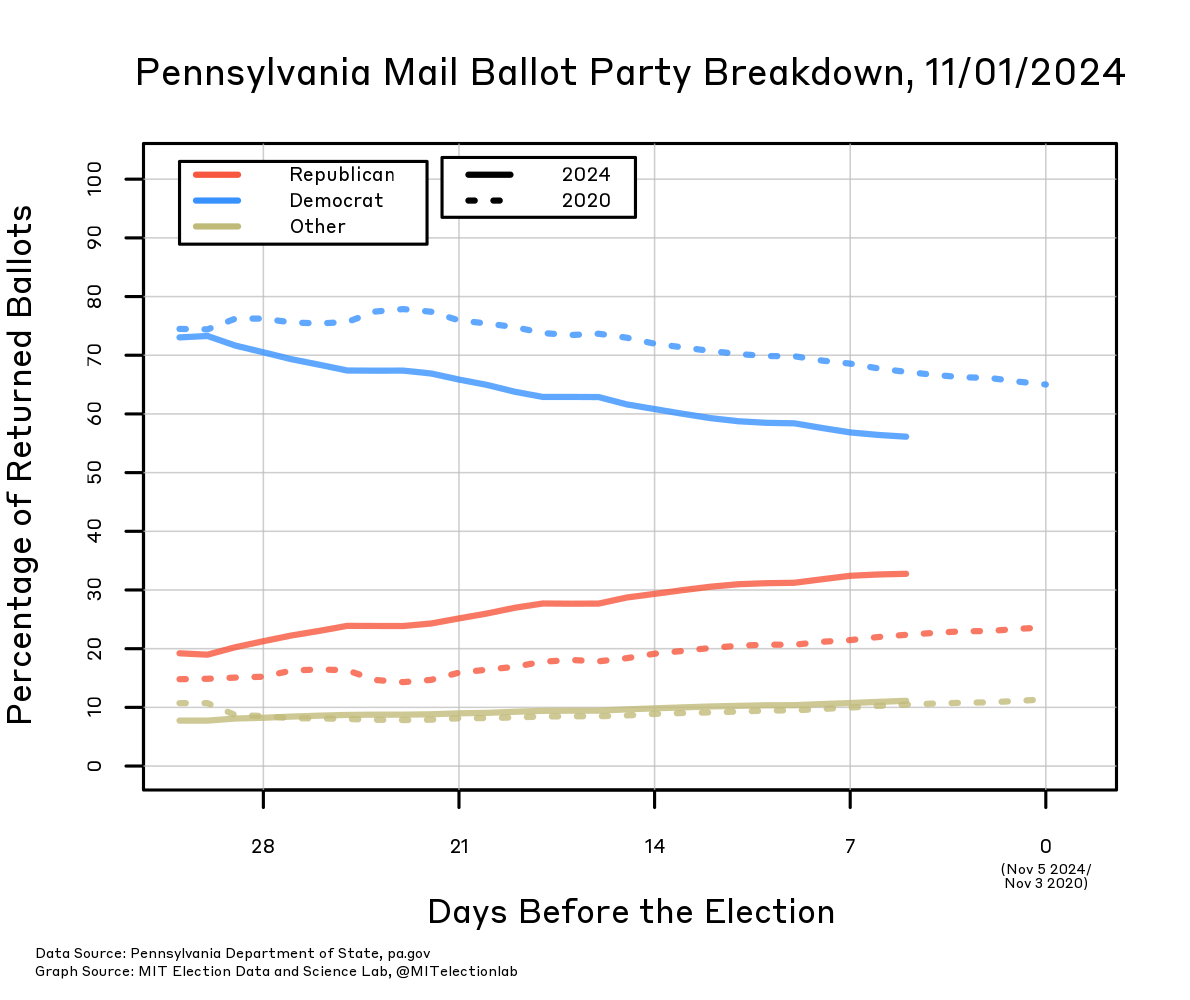
Percentage of returned ballots:
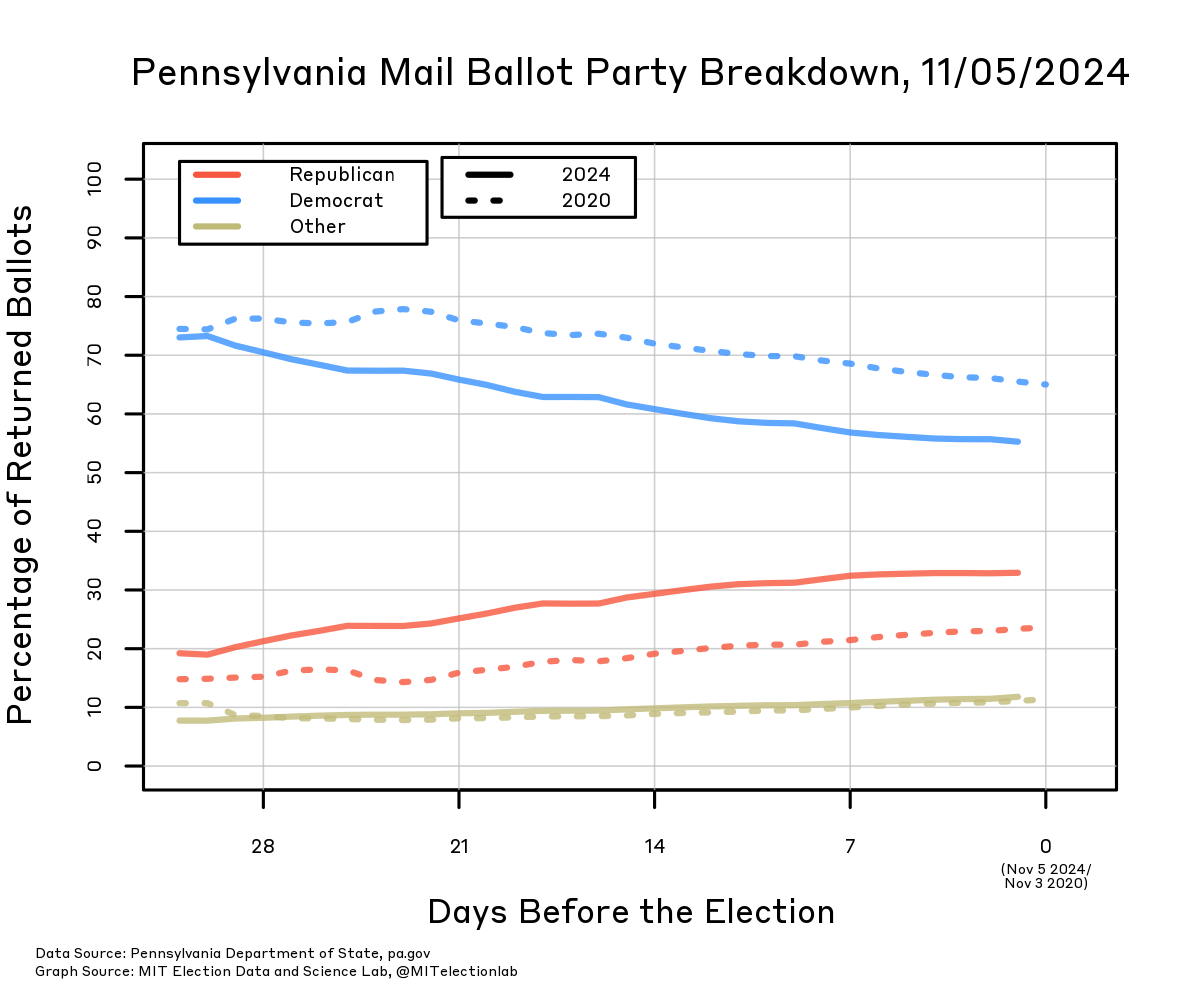
November 4, 2024
Ballots sent and returned:
Percentage of returned ballots:
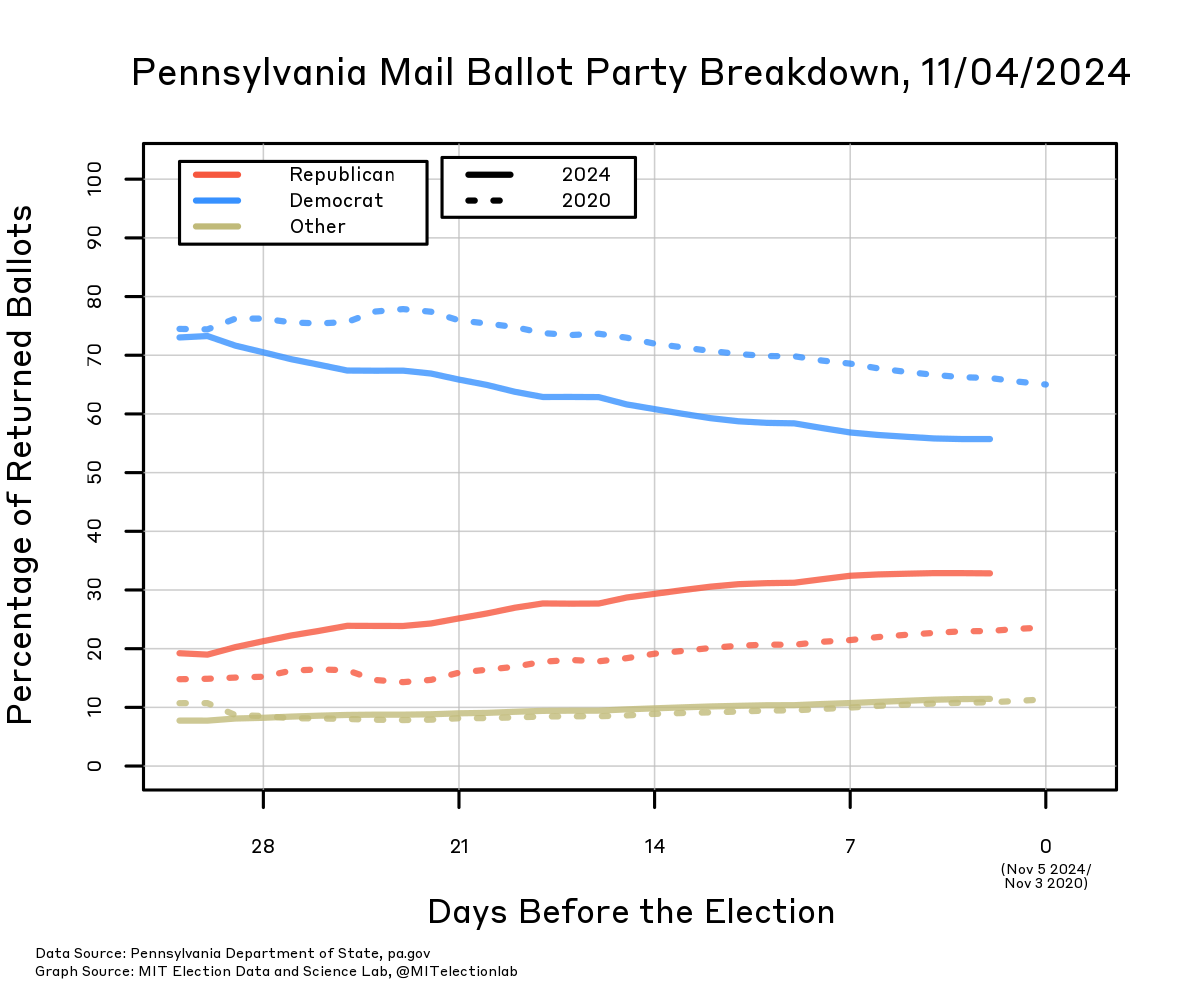
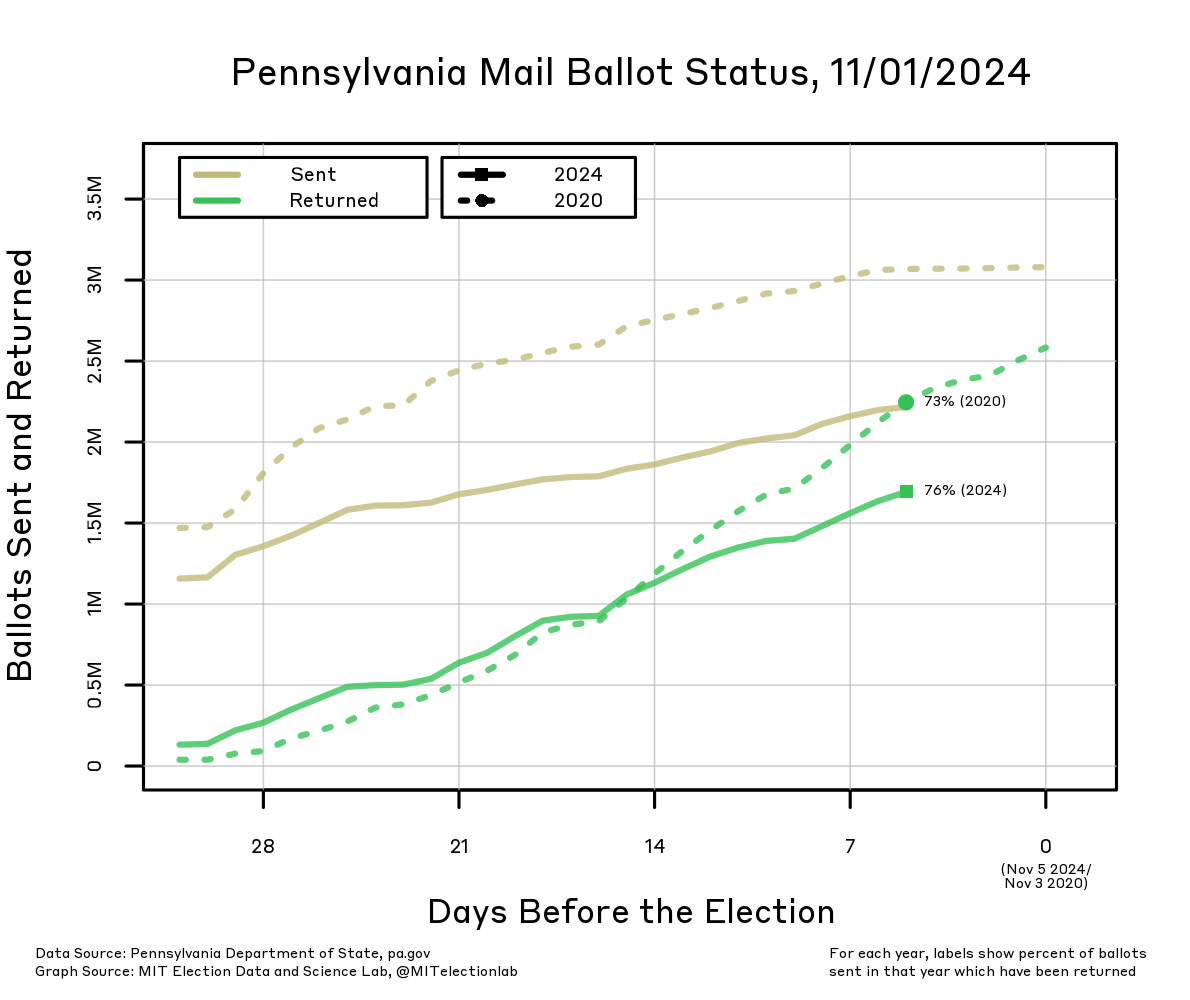
November 1, 2024
Ballots sent and returned:
Percentage of returned ballots:
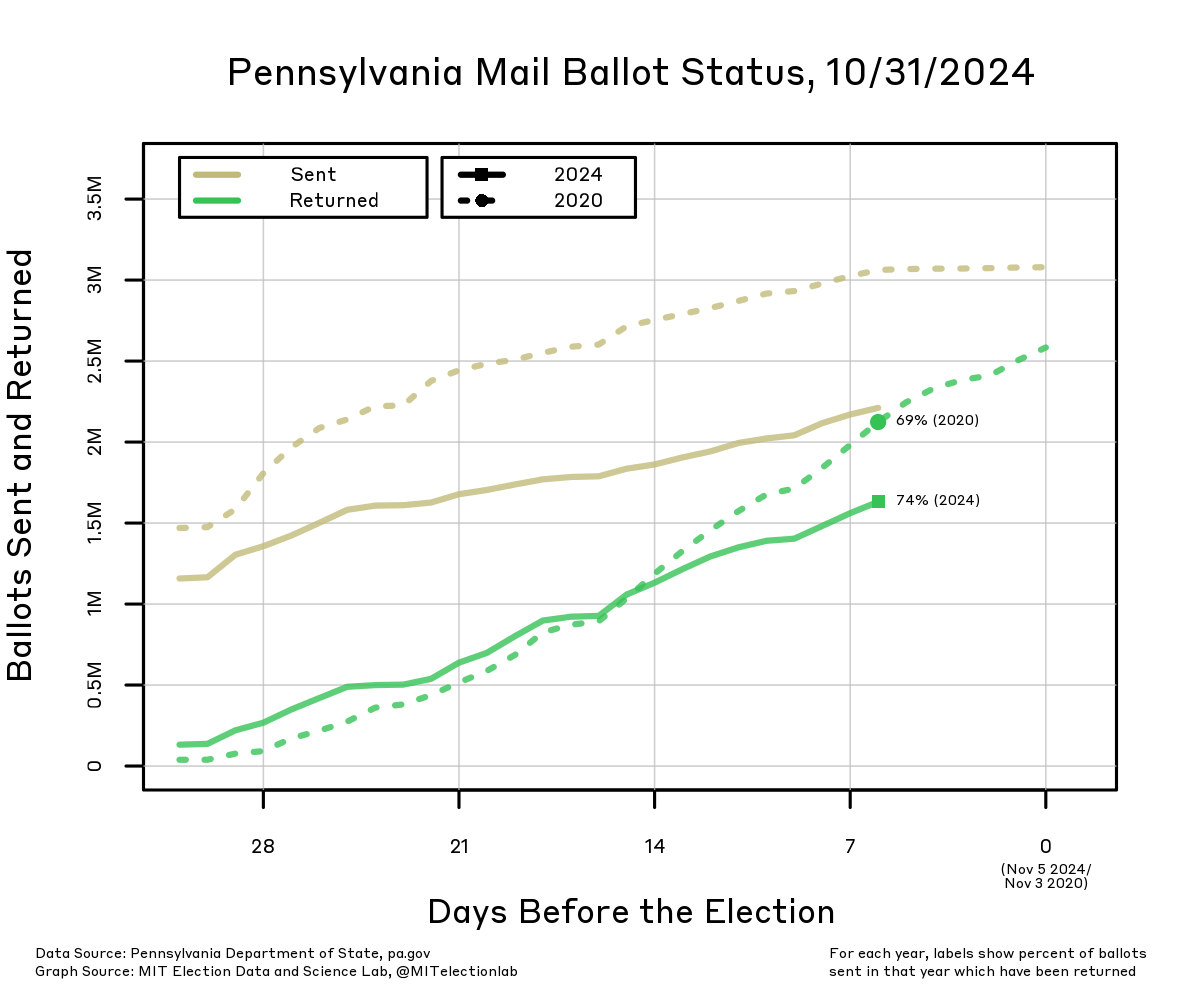
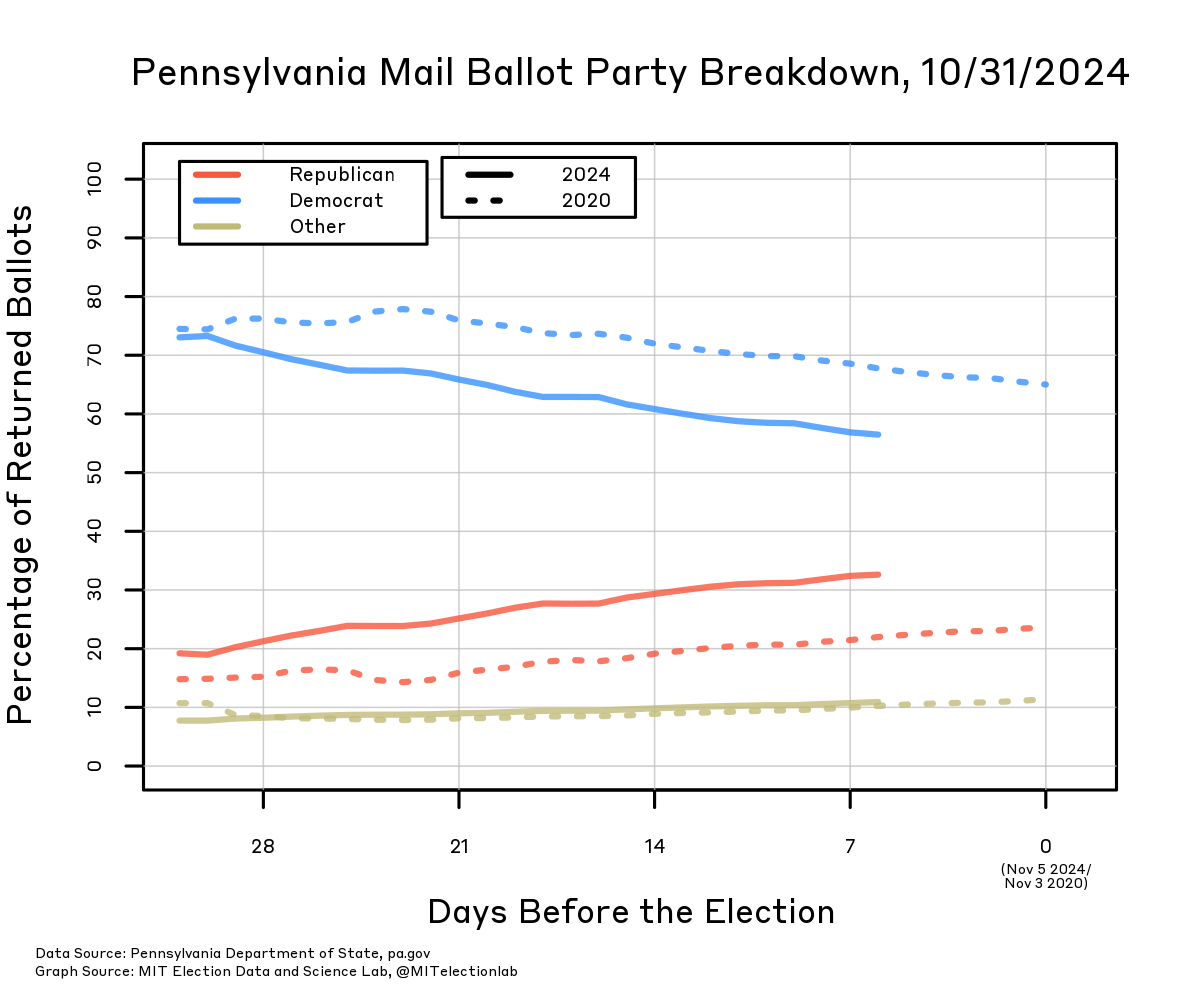
October 31, 2024
Ballots sent and returned:
Percentage of returned ballots:
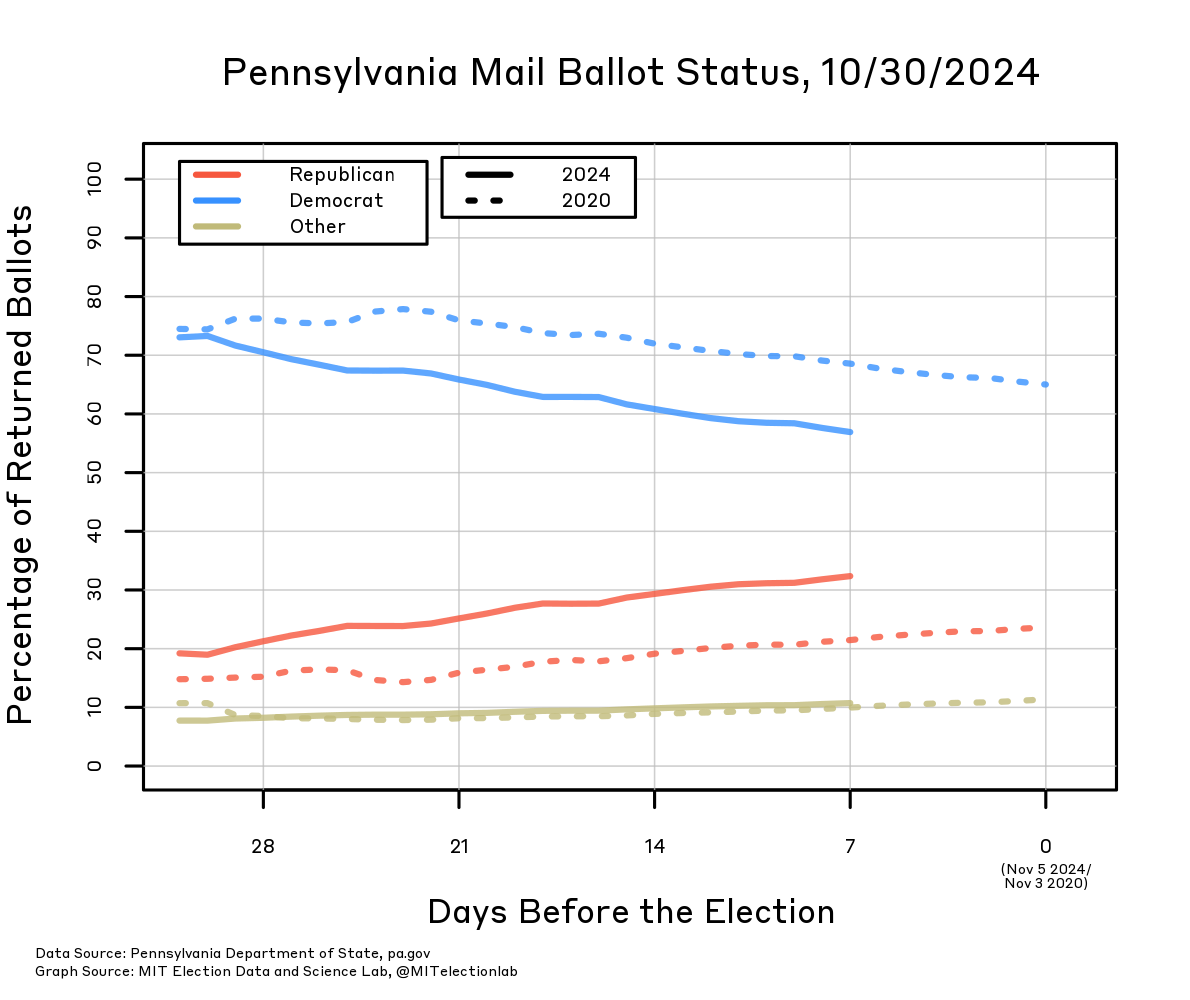
October 30, 2024
Ballots sent and returned:

Percentage of returned ballots:
October 29, 2024
Ballots sent and returned:
Percentage of returned ballots:

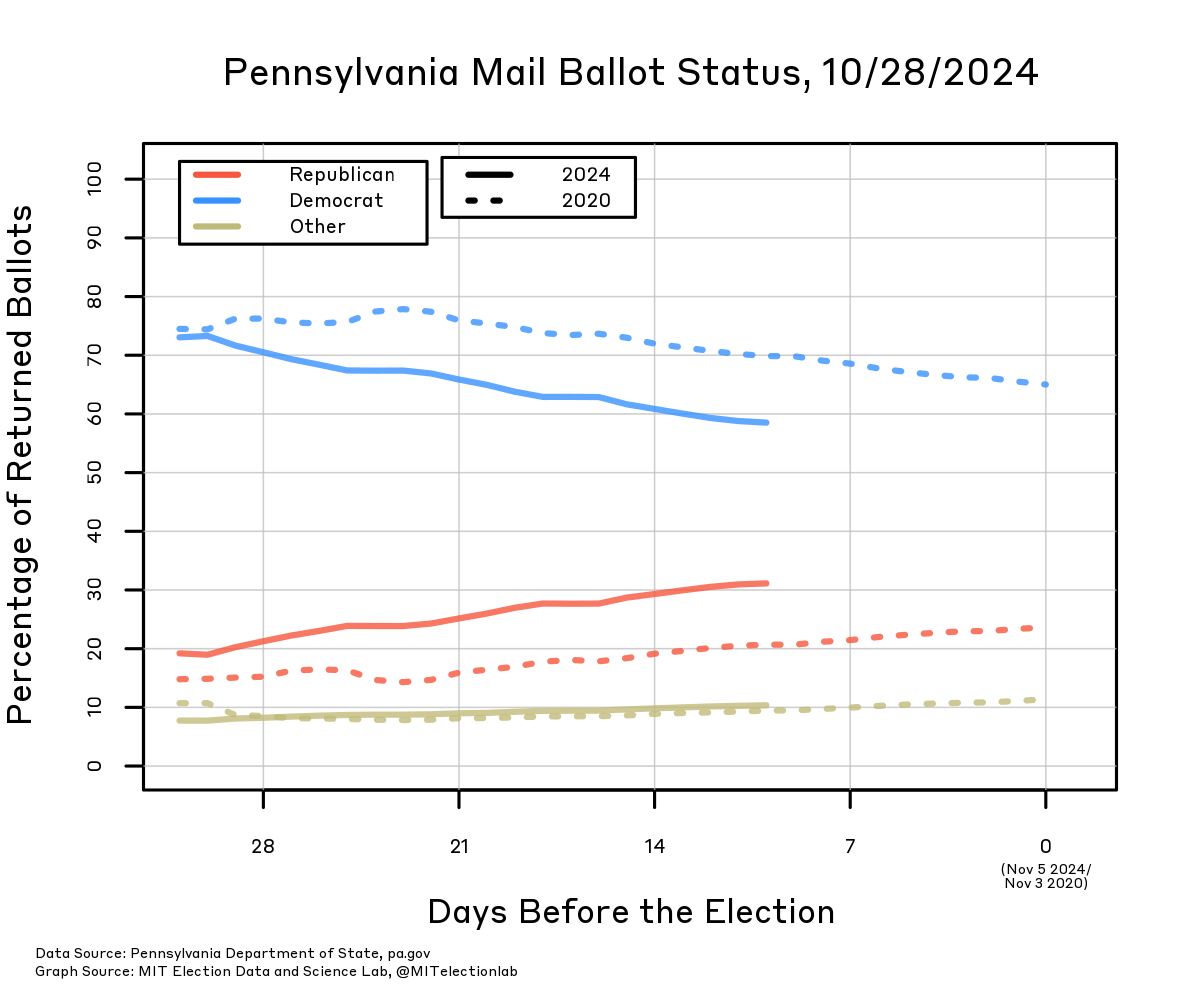
October 28, 2024
Ballots sent and returned:
Percentage of returned ballots:
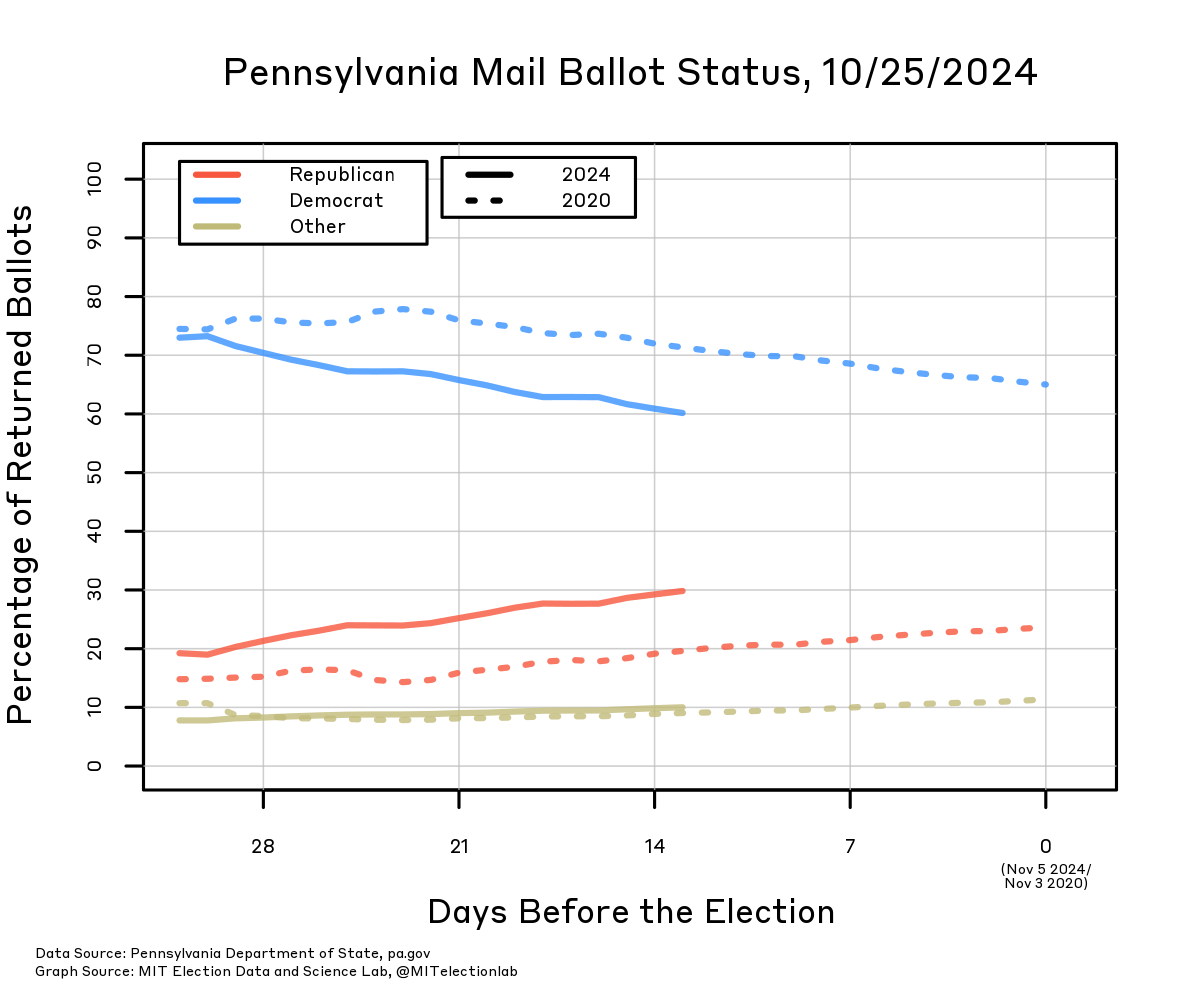
October 25, 2024
Ballots sent and returned:

Percentage of returned ballots:
October 22, 2024
October 21, 2024

October 18, 2024
October 17, 2024
October 16, 2024
October 15, 2024
October 11, 2024
October 10, 2024
October 9, 2024
October 8, 2024
October 7, 2024
October 4, 2024

October 3, 2024

October 2, 2024
October 1, 2024
September 30, 2024
September 27, 2024
September 26, 2024
September 25, 2024
September 24, 2024
September 23, 2024
September 20, 2024
September 19, 2024
September 18, 2024