Key State
Last updated: Nov 05, 2024
North Carolina
Memos
North Carolina is a swing state expected to be important to the presidential candidates in the general election. Given this significance, it is useful to examine its election administration and primary election results. Changes in election policies can indicate what key issues may be encountered within the state. Turnout and results from the primary can also provide insight into what is to come in the state’s general election.
Memo
/ July 26, 2024
State Resources
Data Visualizations
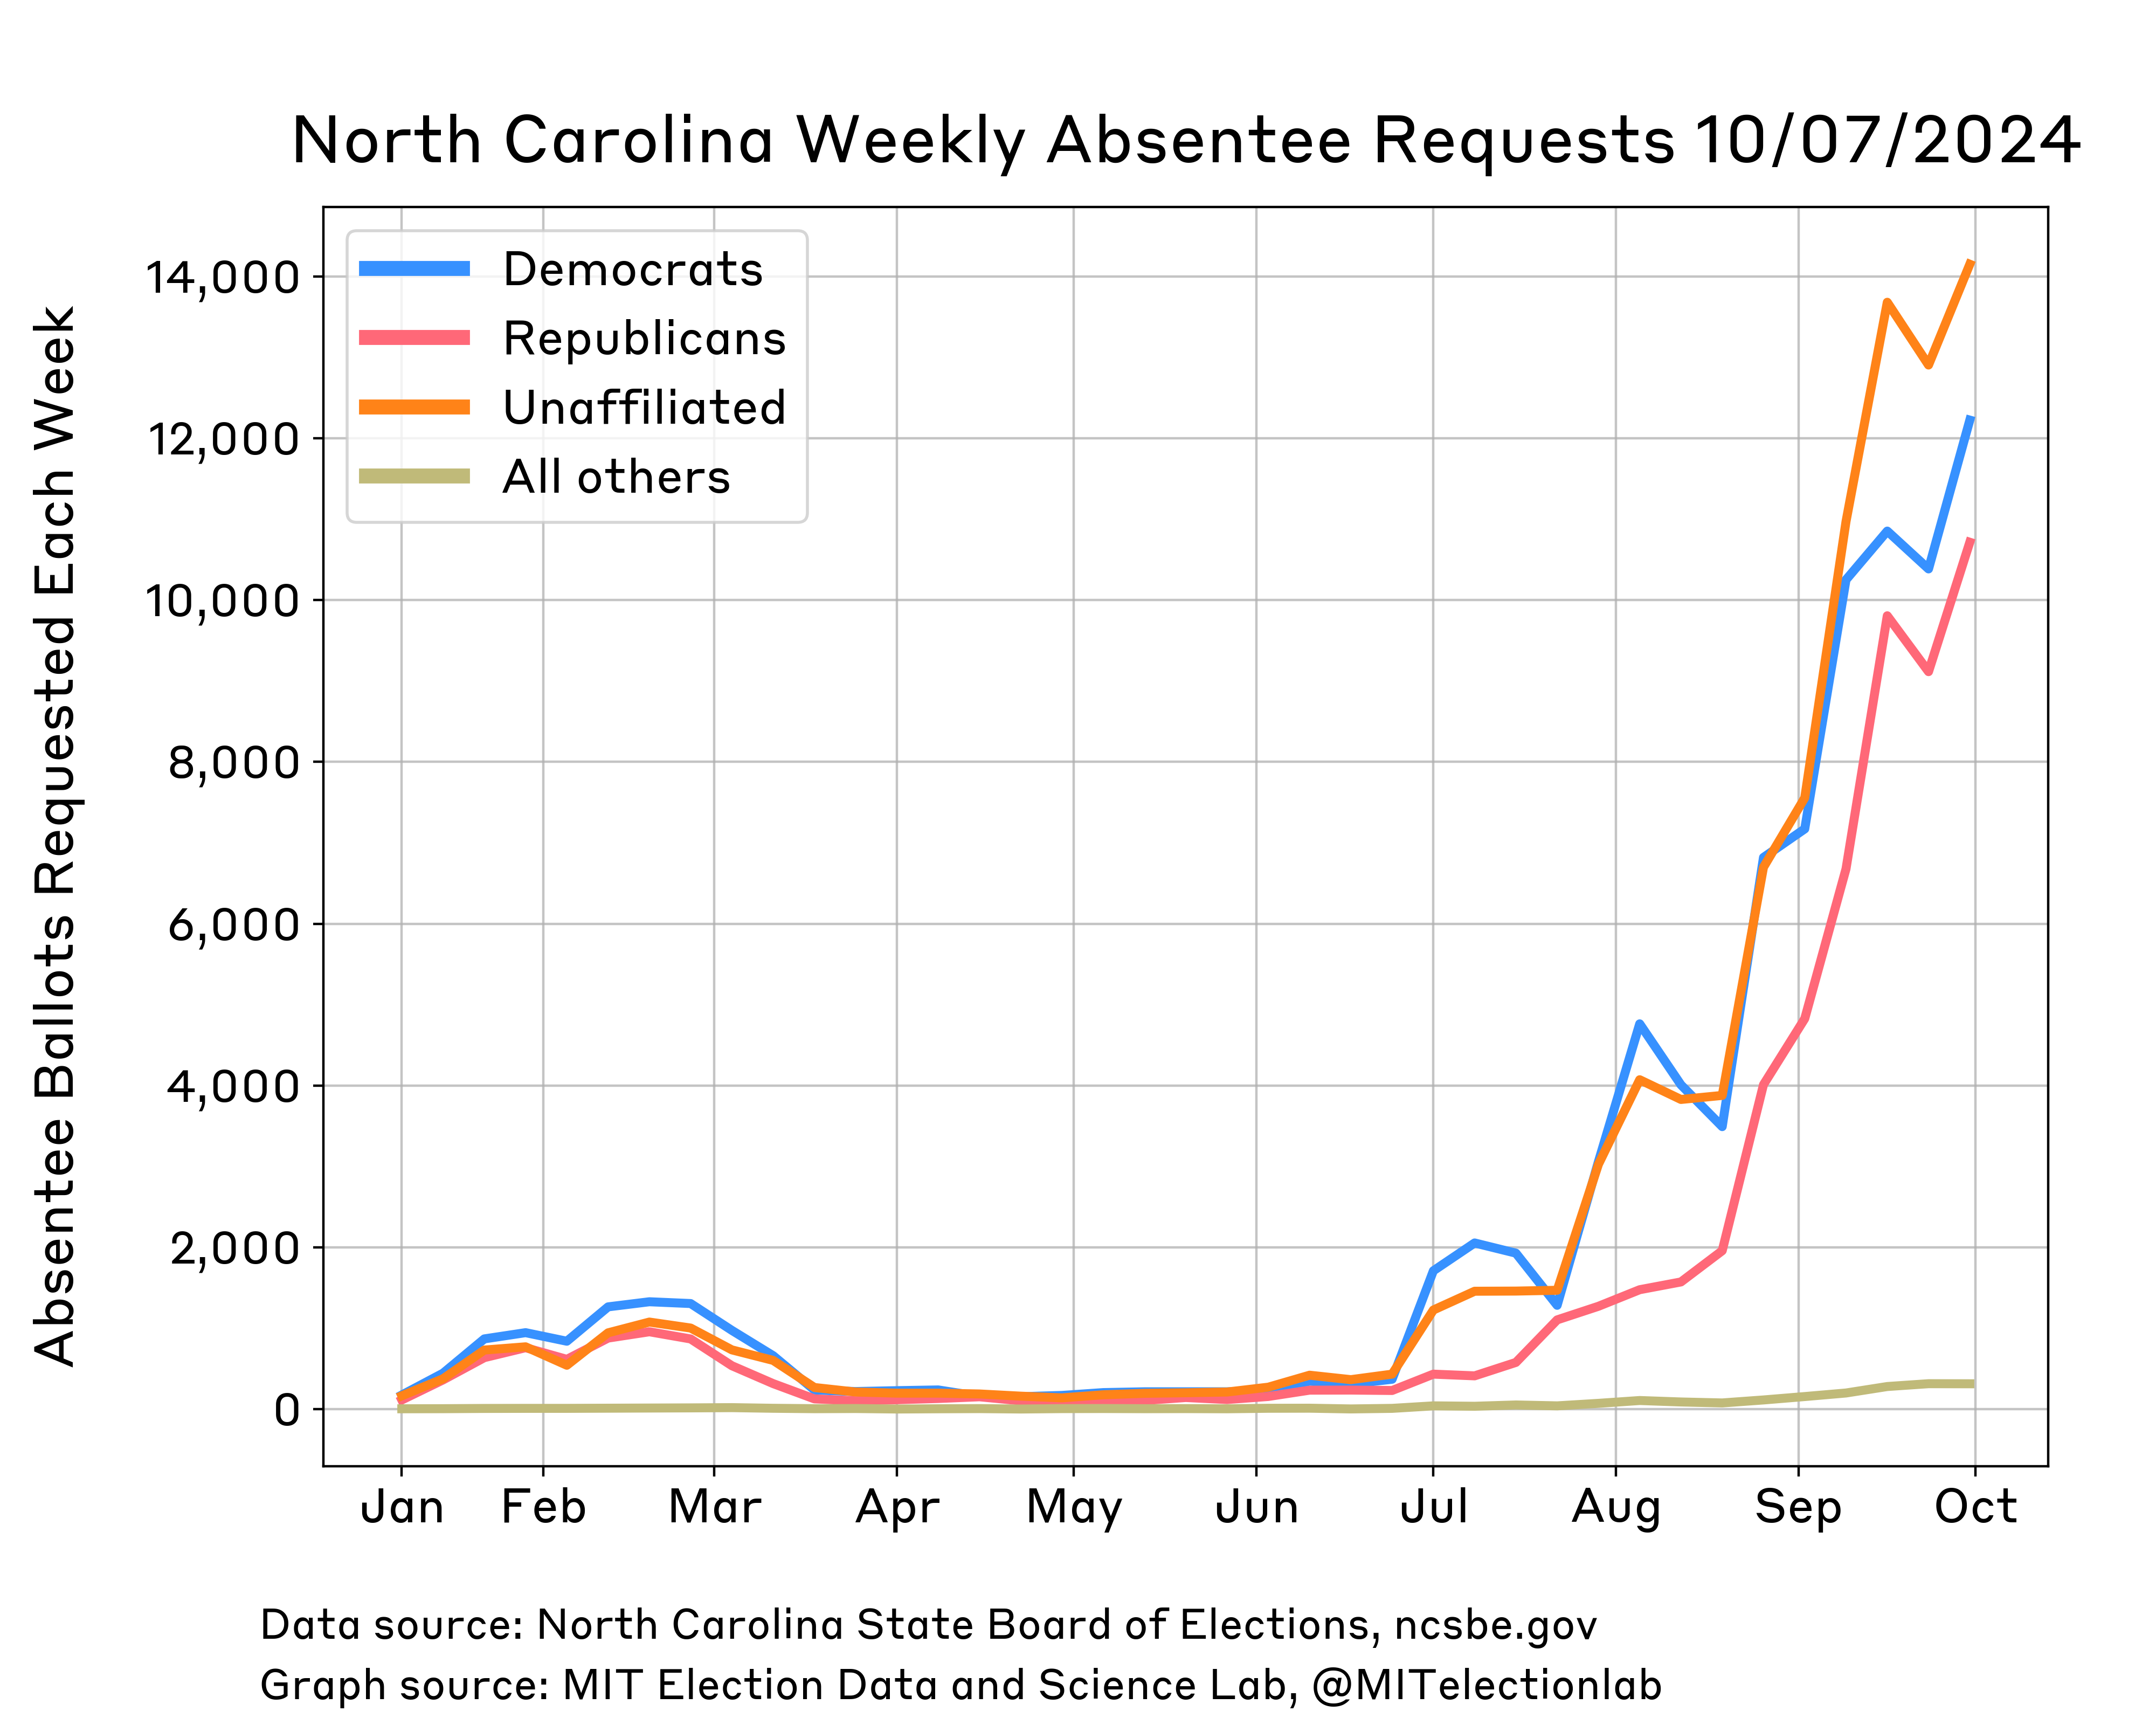
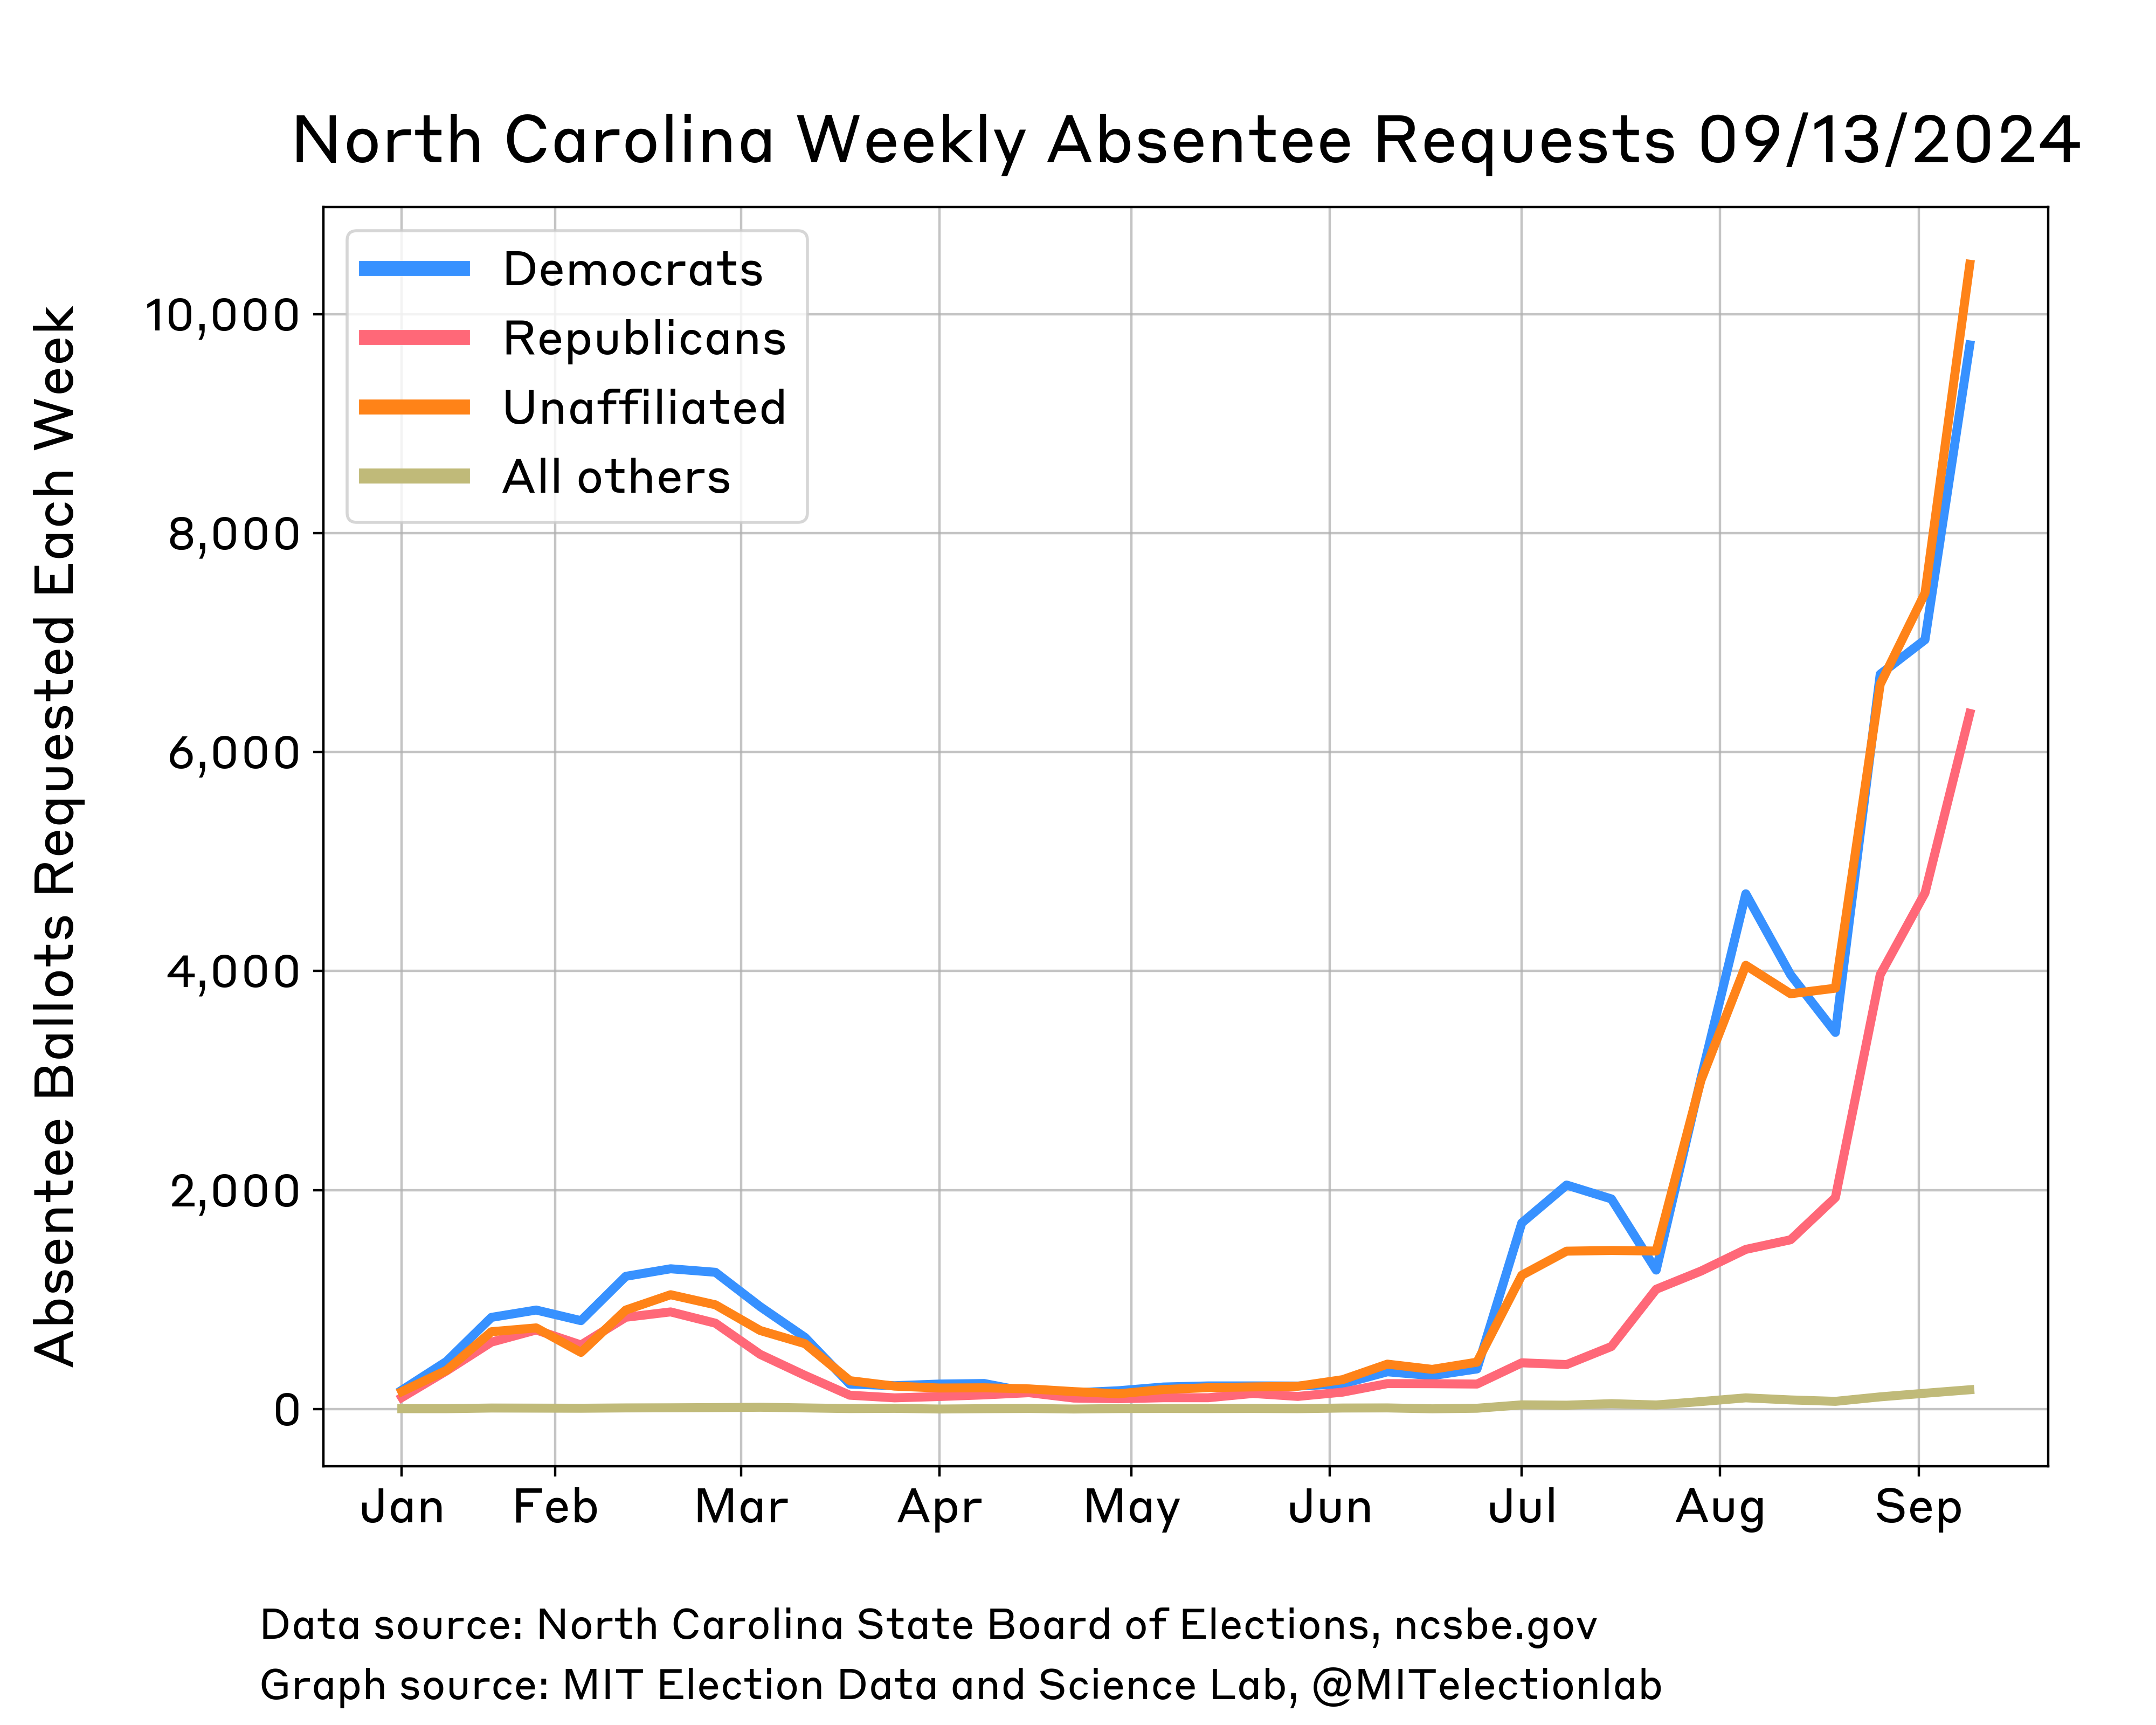
Absentee Requests
Last updated: October 7, 2024
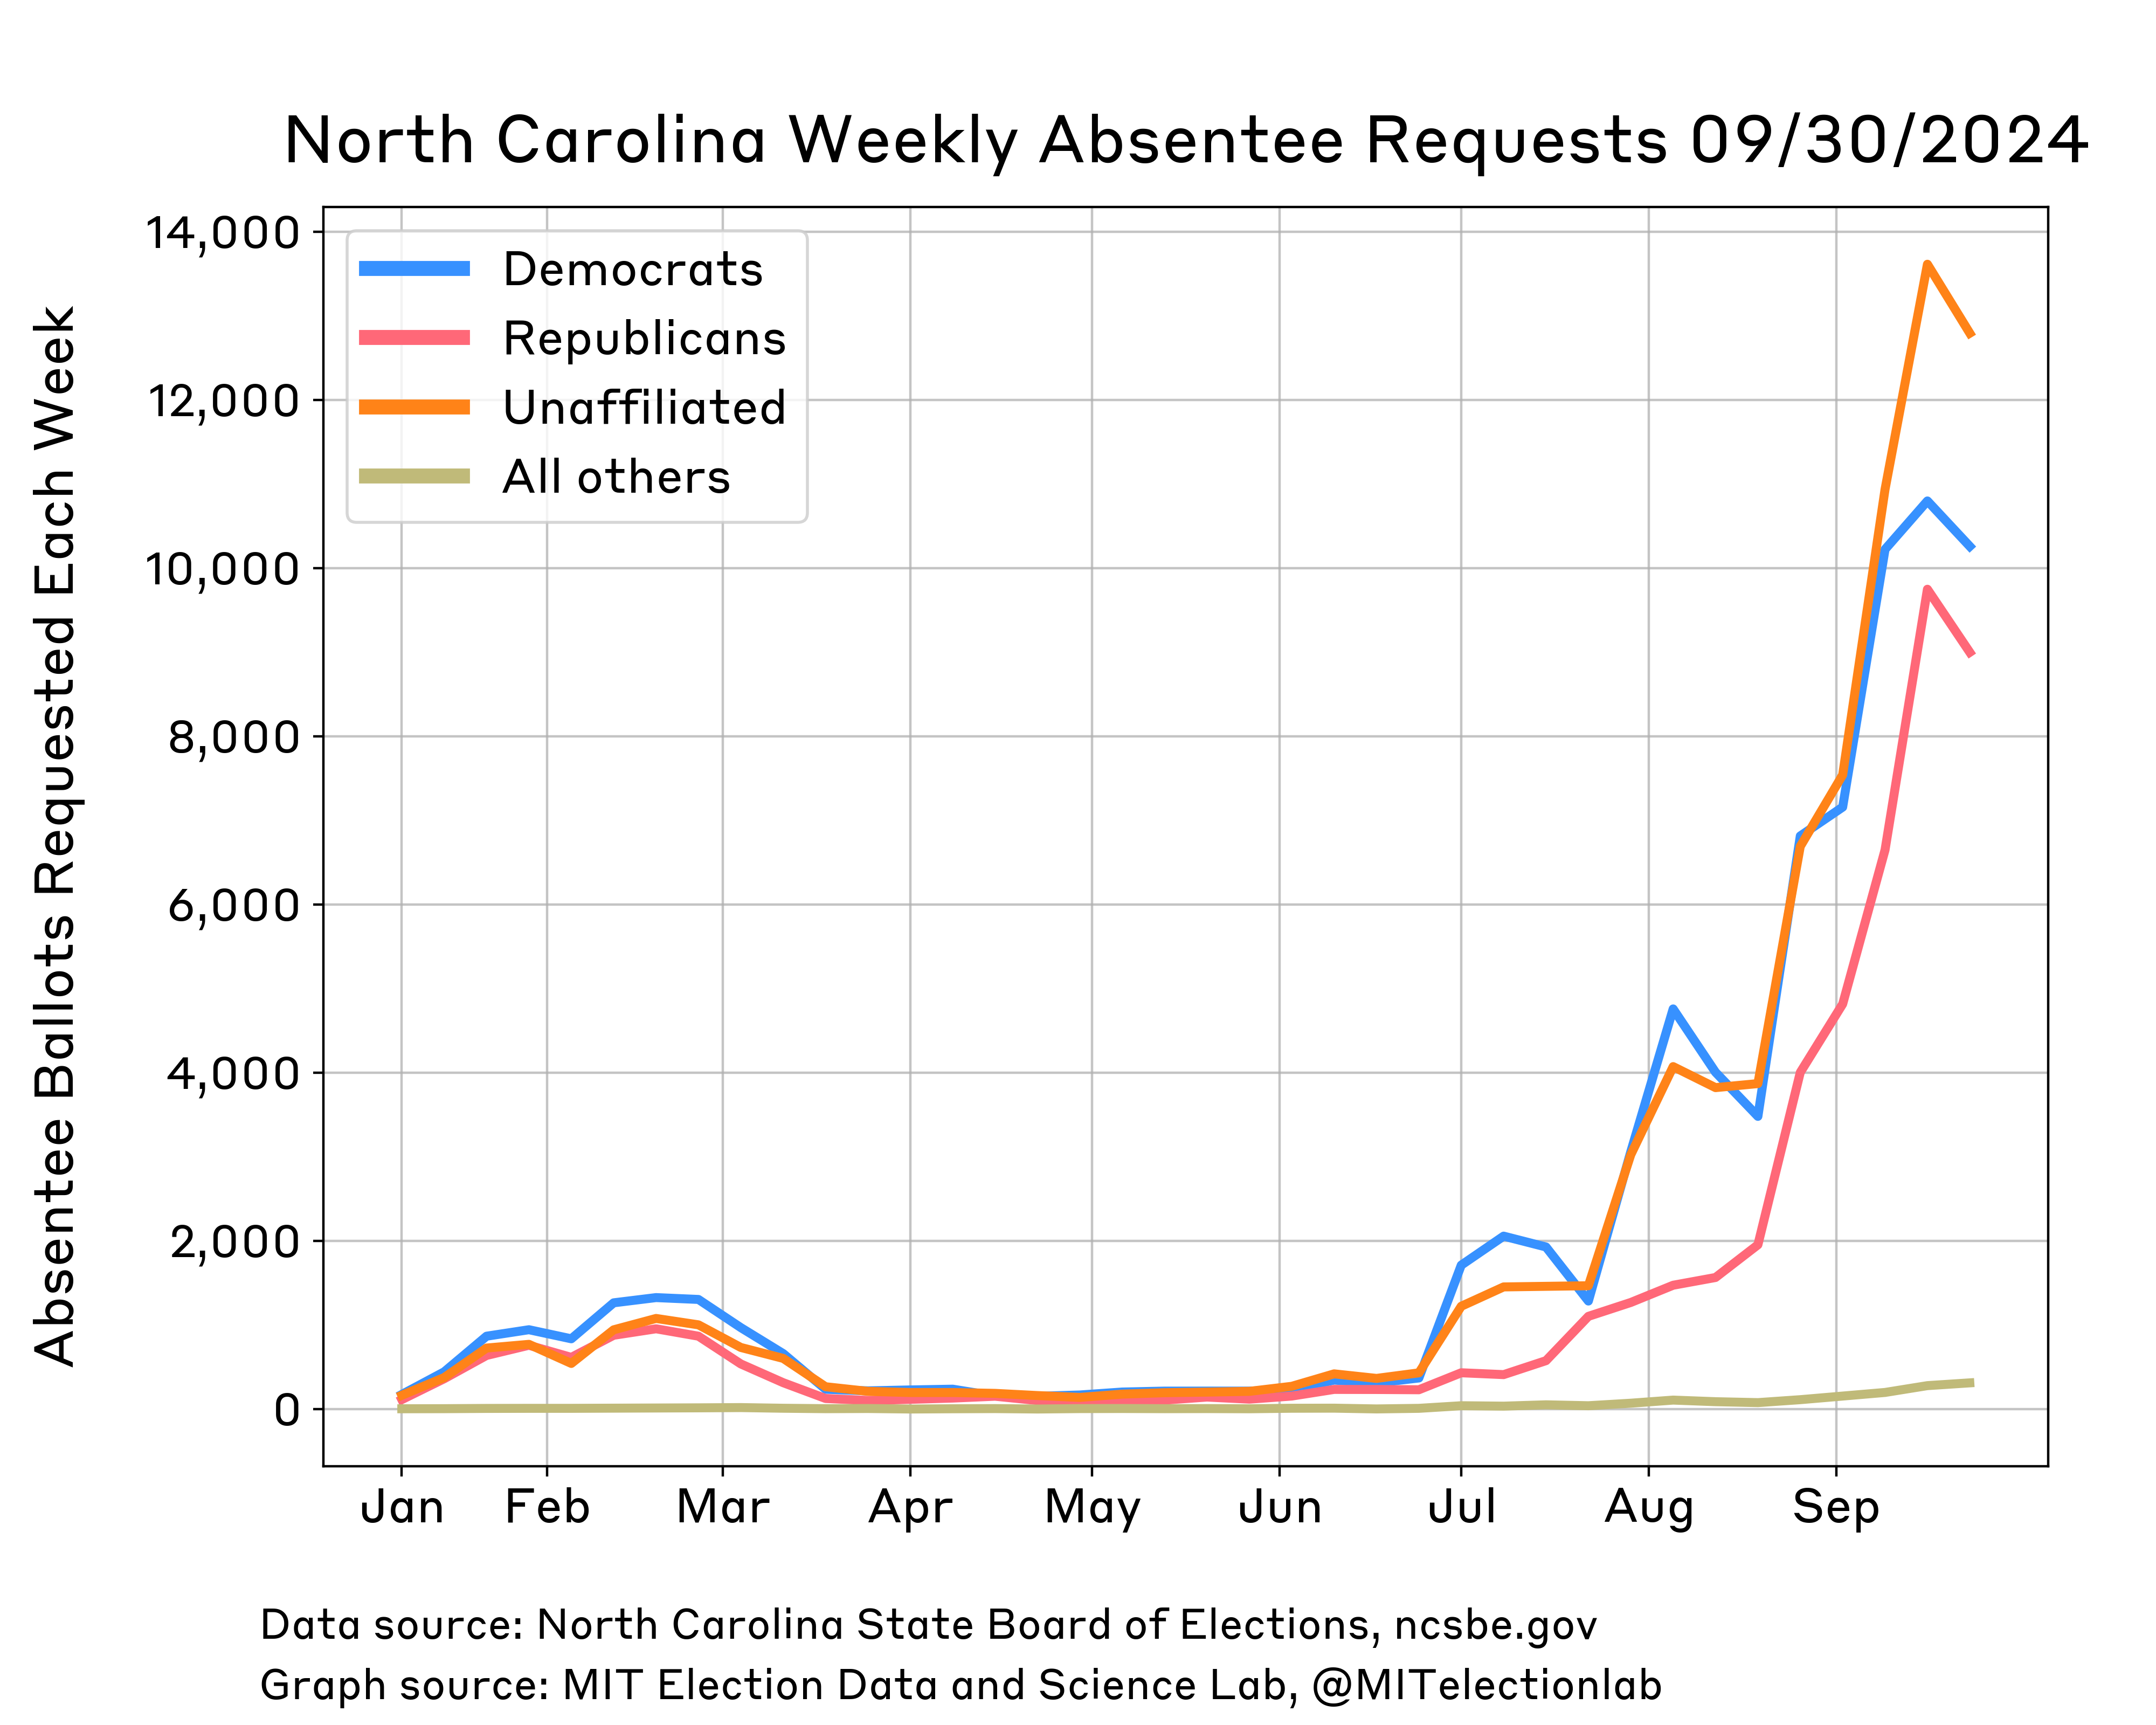
September 30, 2024
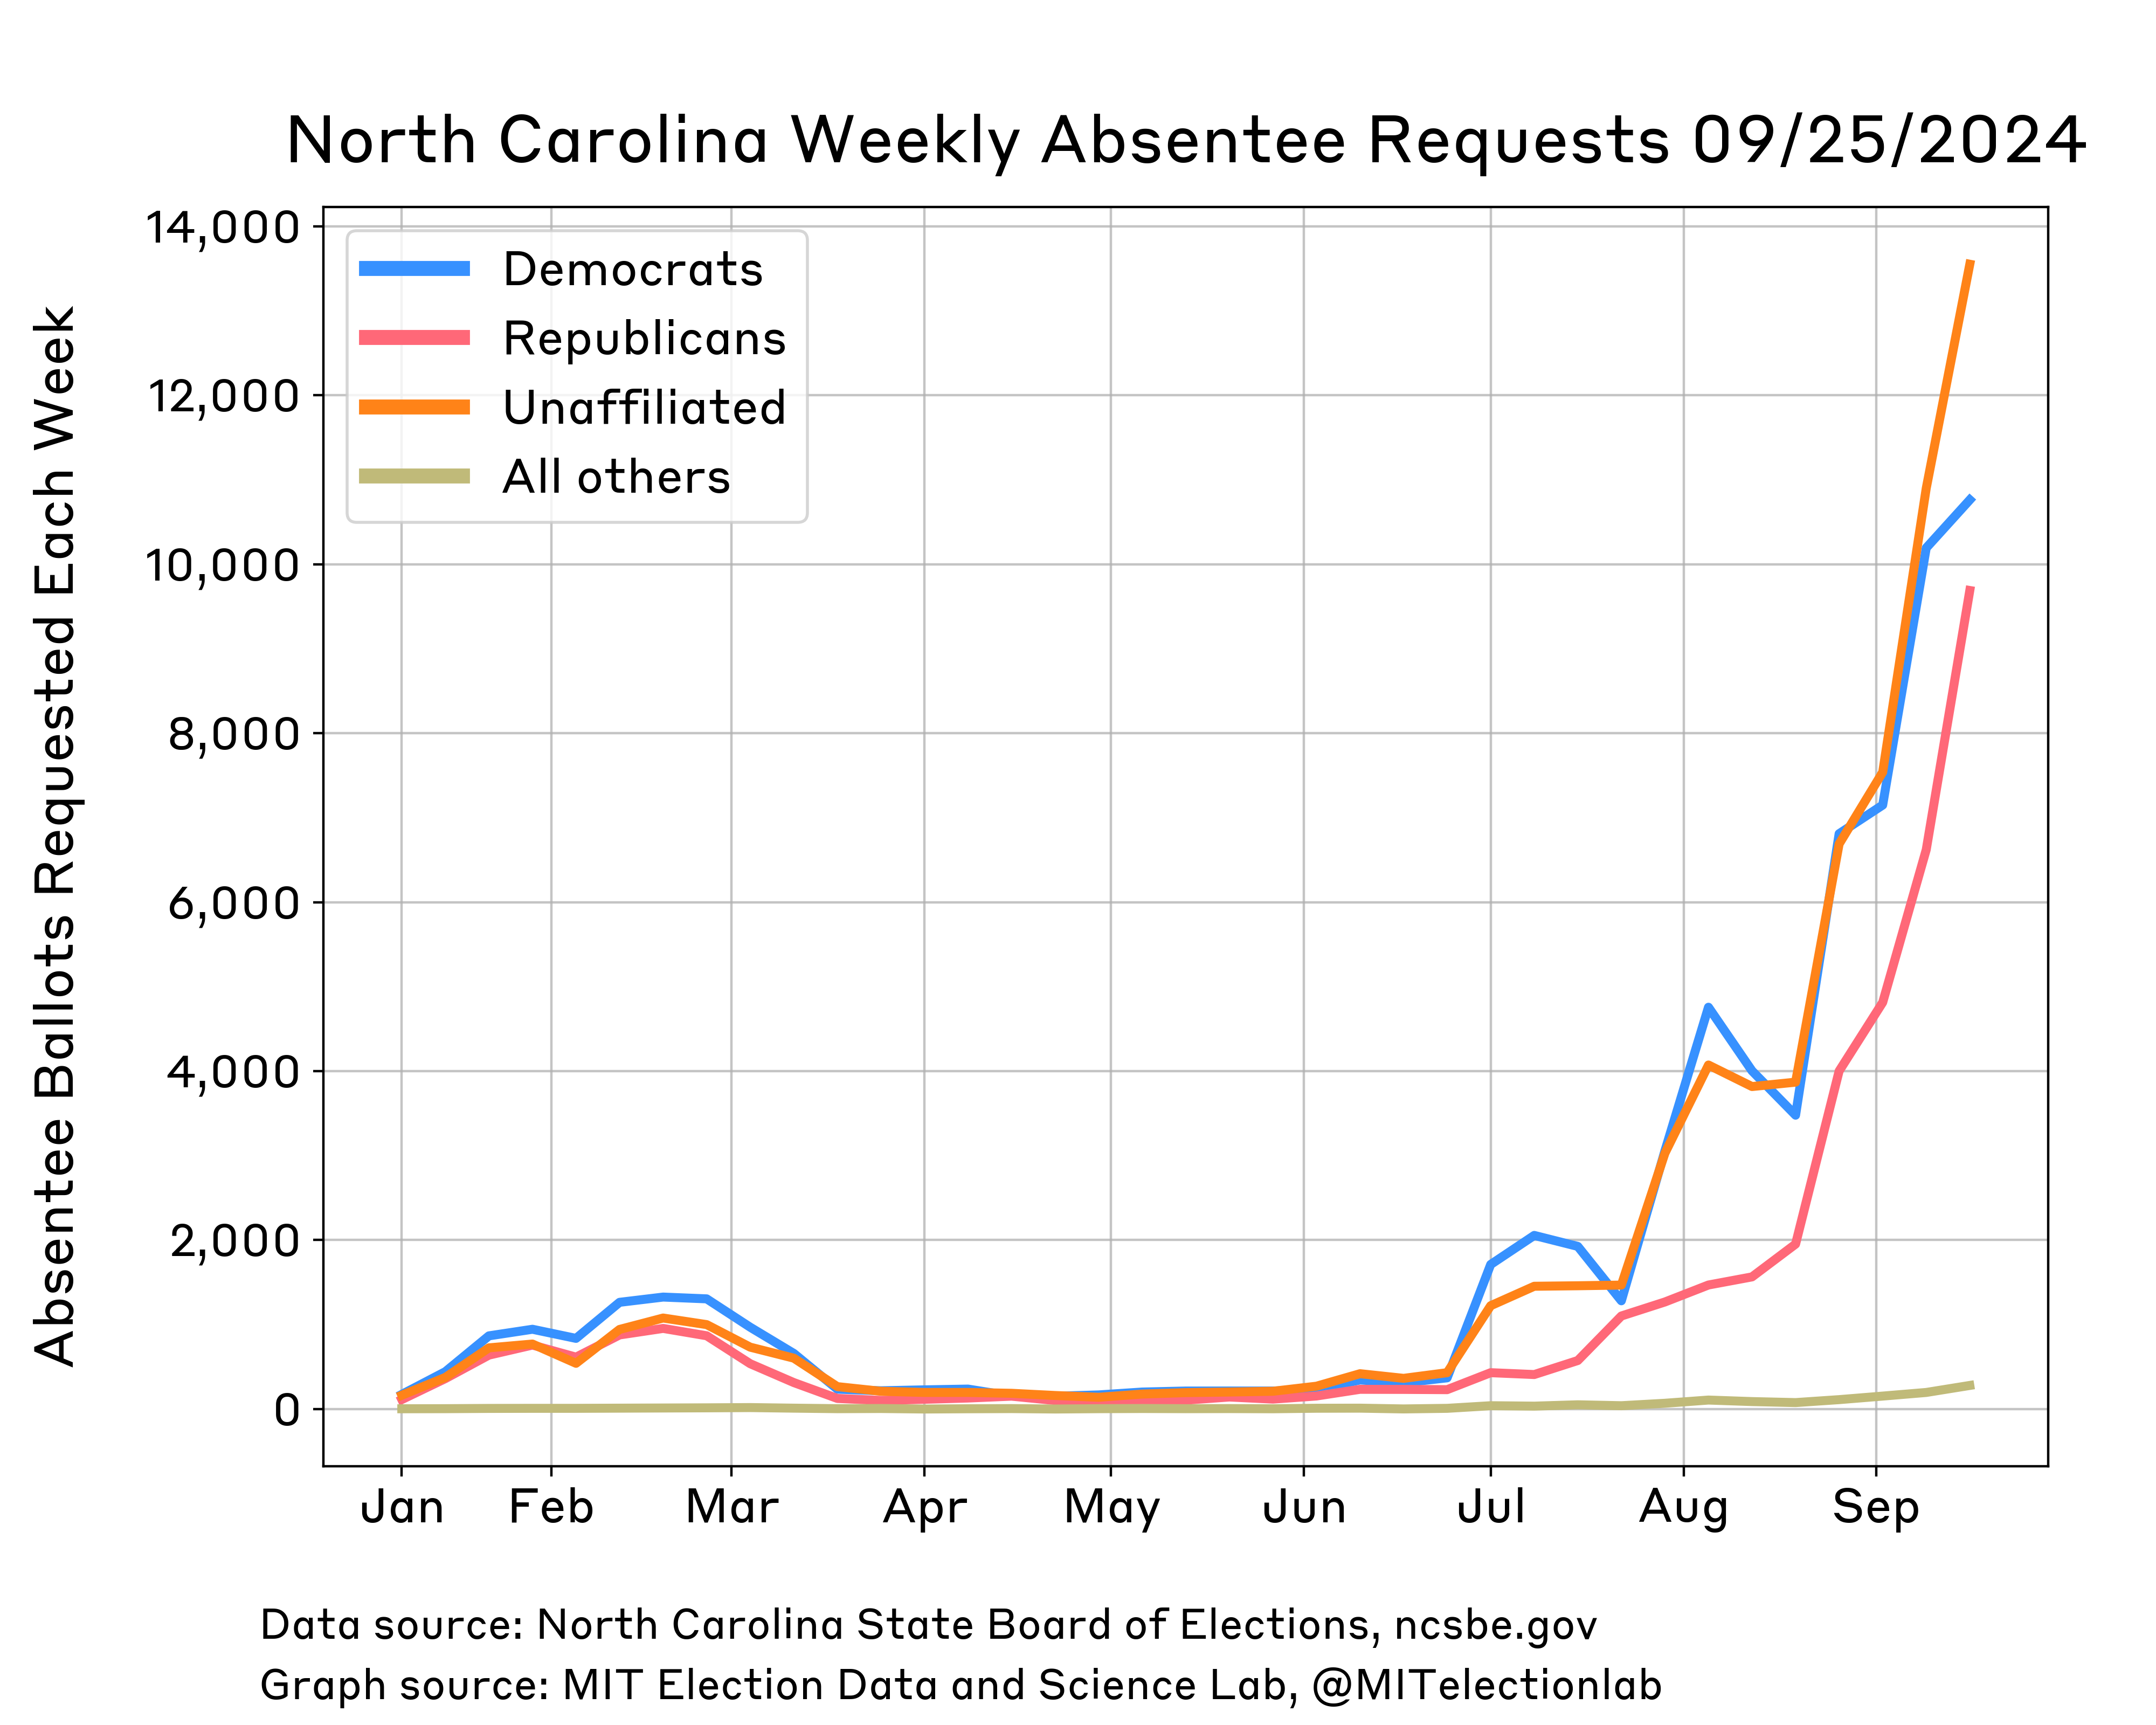
September 25, 2024
September 13, 2024
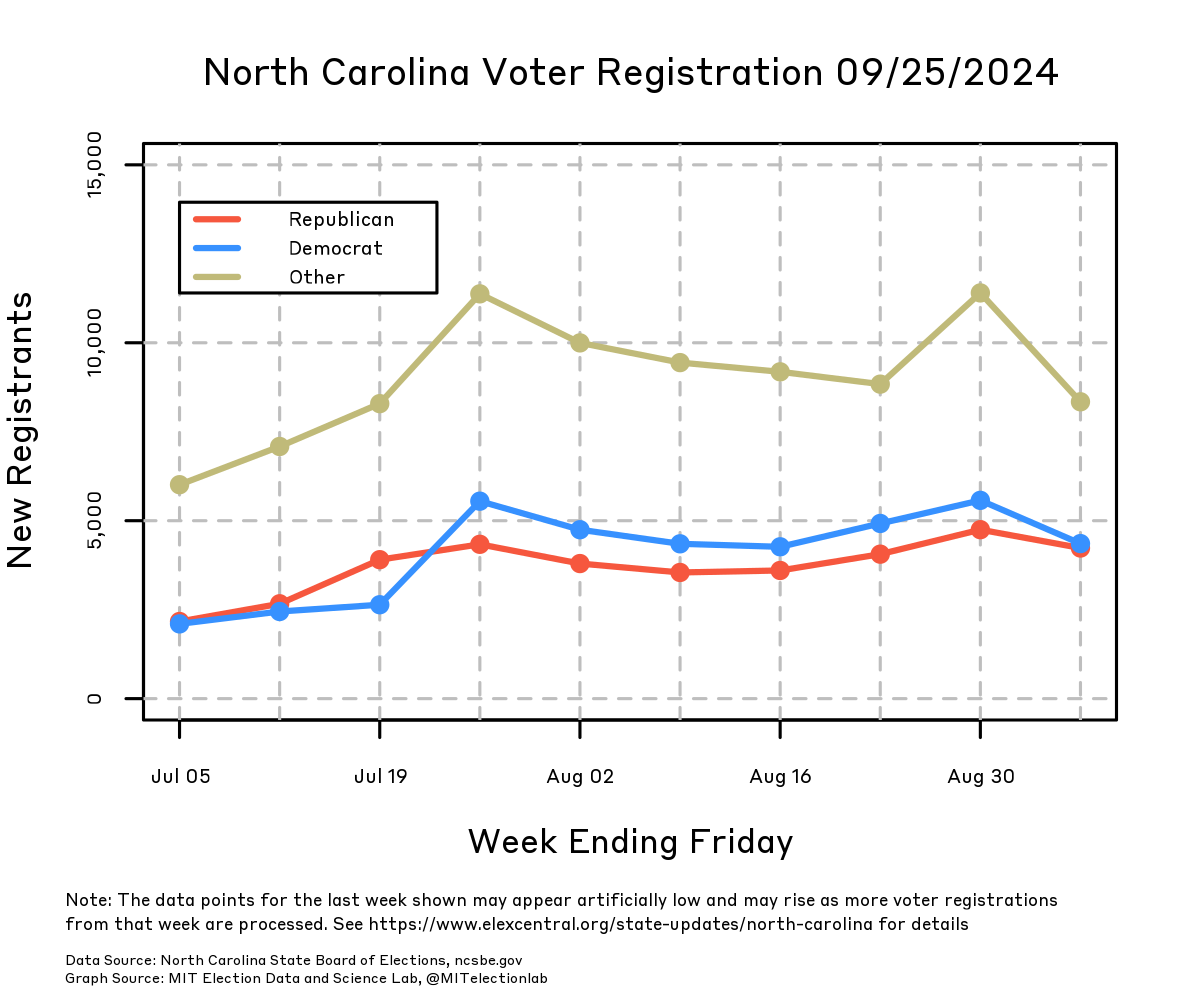
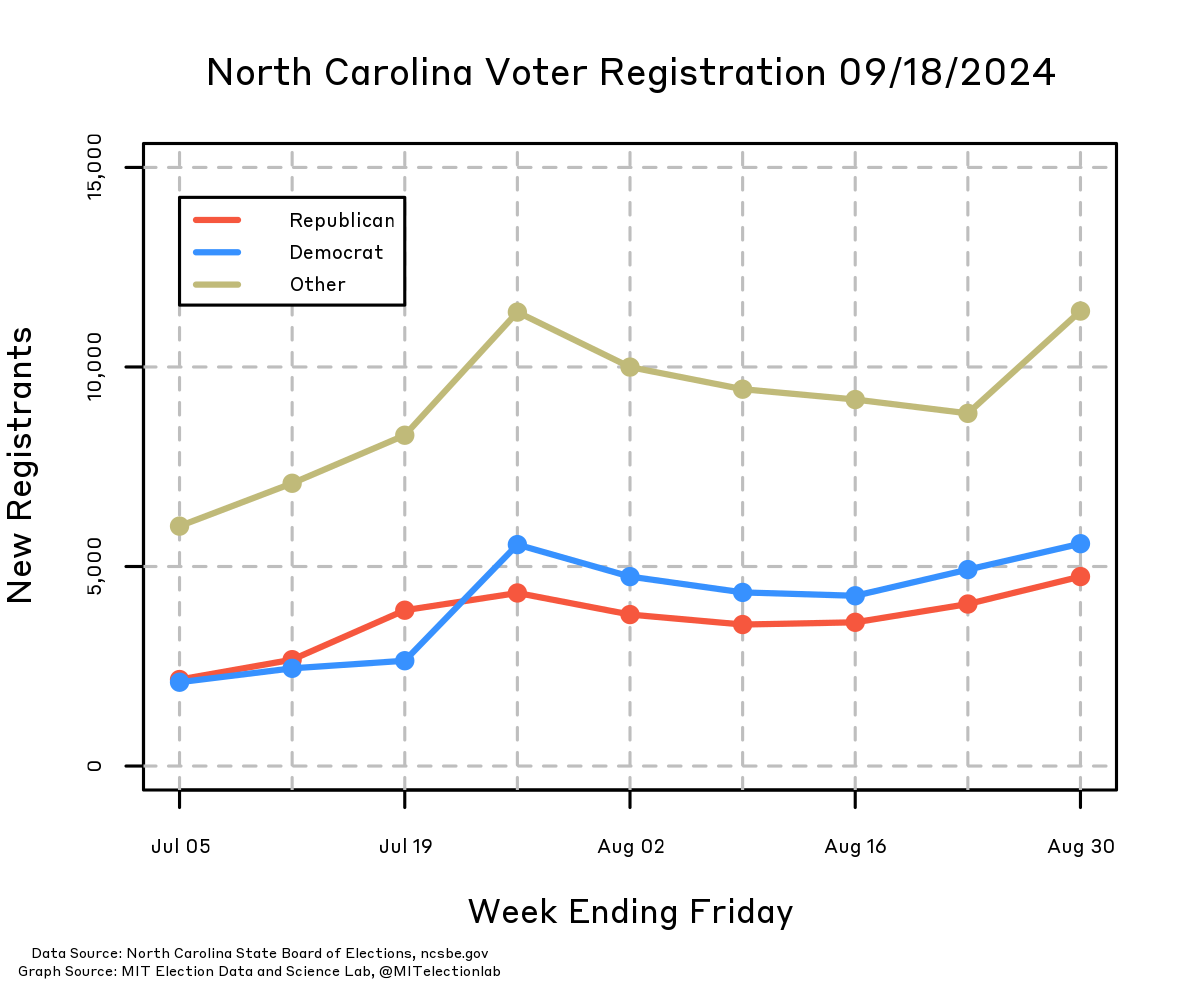
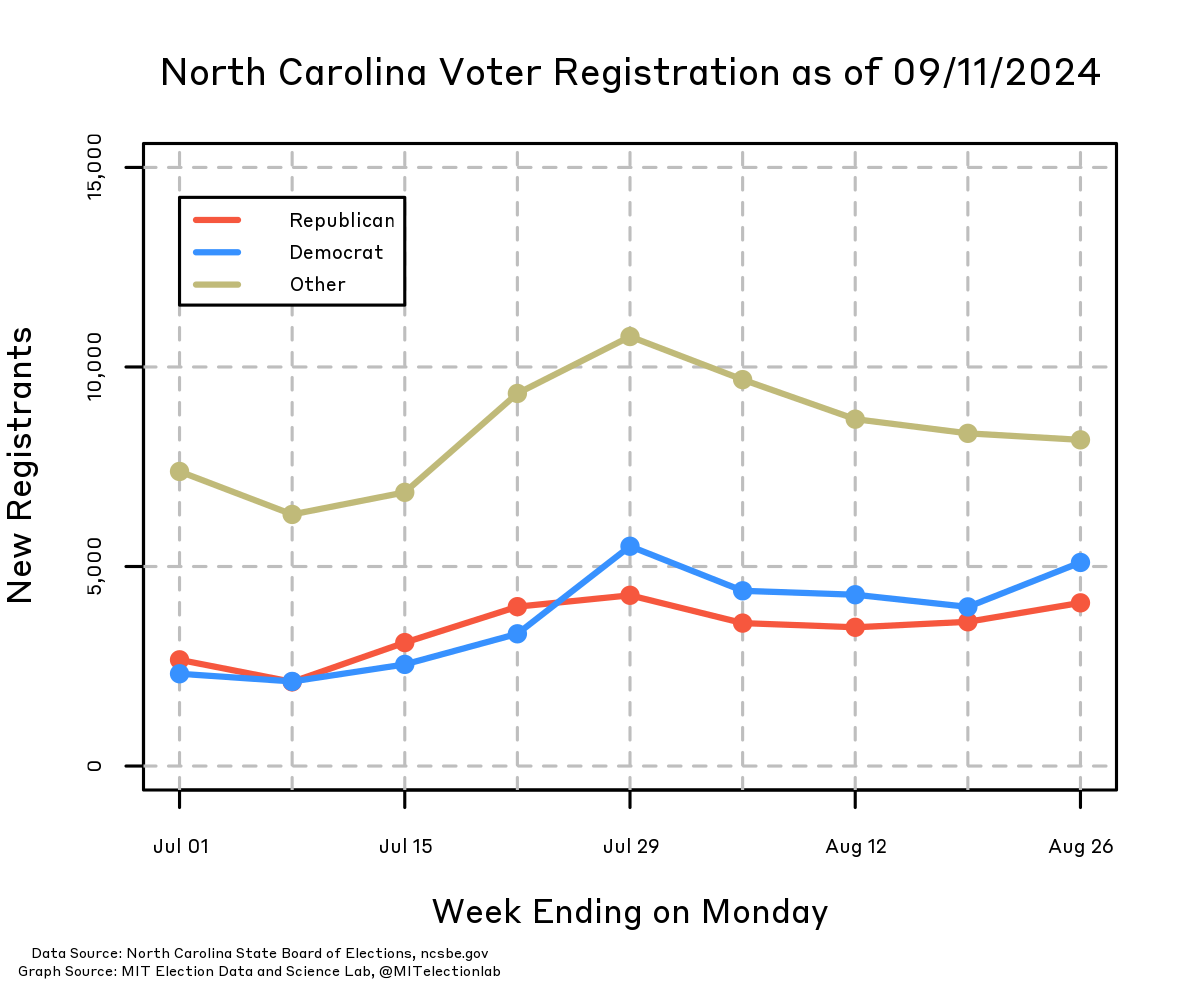
Voter Registration
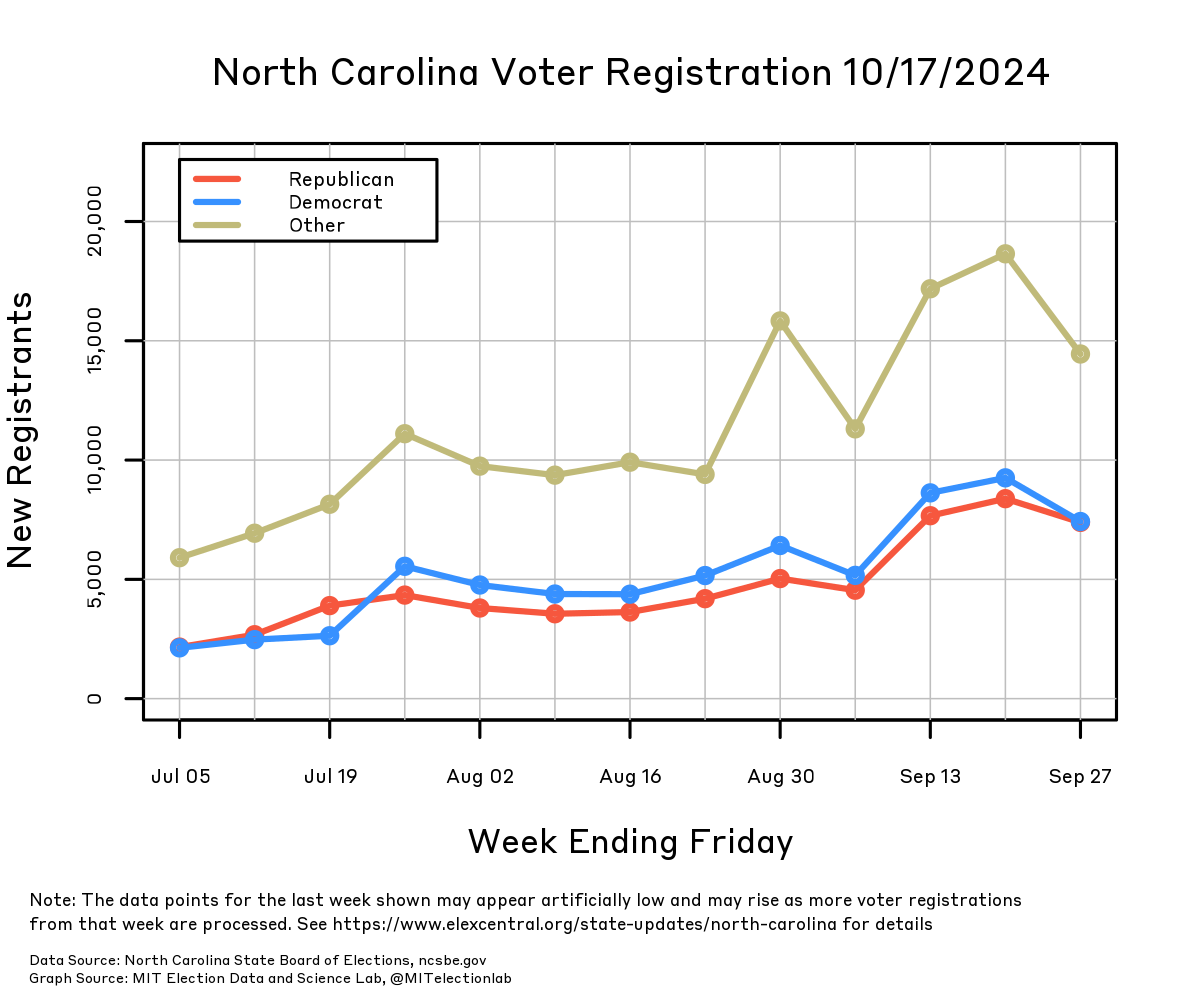
The number of new voters is calculated every week using the snapshots of the North Carolina voter file that are posted by the state's Board of Elections. Throughout the 2024 pre-election period, the North Carolina voter file online snapshots have been posted on the weekend, and the date on our plot is the first workday after each update of the online voter file.
To avoid double-counting registrations that were approved on a Monday, each data point represents the number of new registrants from the previous Tuesday through the Monday indicated, inclusive. Importantly, the last date on the x axis is also set to be at least two weeks before the date when we actually conduct the analysis. This two week buffer aims to balance two priorities: providing the most recent data possible, and the completeness of the data that we post.
Although snapshots of the voter file are made available each weekend, registrations may not be processed immediately, and there is no number of days after which a registration application is guaranteed to have been processed. Preliminary tests indicated that the days immediately preceding each update of the voter file shows notably low new voter registration, simply because any registration attempts on (e.g.) a Friday are unlikely to be processed before the voter file is updated one day later on Saturday, so a plot that spans up to the current date could give the inaccurate impression that the number of new registrants has suddenly fallen when really their applications have simply not yet been processed. For this reason, previous data points on our plots may rise slightly as older applications are processed.
Two more decisions affect the values in our plots, and may also cause small movements among older data points:
First, we only count registrations that have a status code of either Active or Temporary, omitting Denied, Removed, or Inactive registrations. If a voter switches from one of these categories to another, it could affect the number of Active or Temporary registrants as of a given date.
Second, because our goal is to understand the current electorate of North Carolina, we always use the most recent snapshot of the voter file in order to compute the number of new registrants as of a certain date. This means that if a voter were to register for the first time in (say) the last week of July, but then leave the voter file for any reason before we post our plot in (say) September, our data point for the number of newly registered voters in the last week of July will decrease by one in the September plot compared to the same data point on a plot from July. The specific quantity that we are plotting is therefore the number of currently registered voters in North Carolina with either Active or Temporary status who originally registered in a given week.
Last updated October 17, 2024
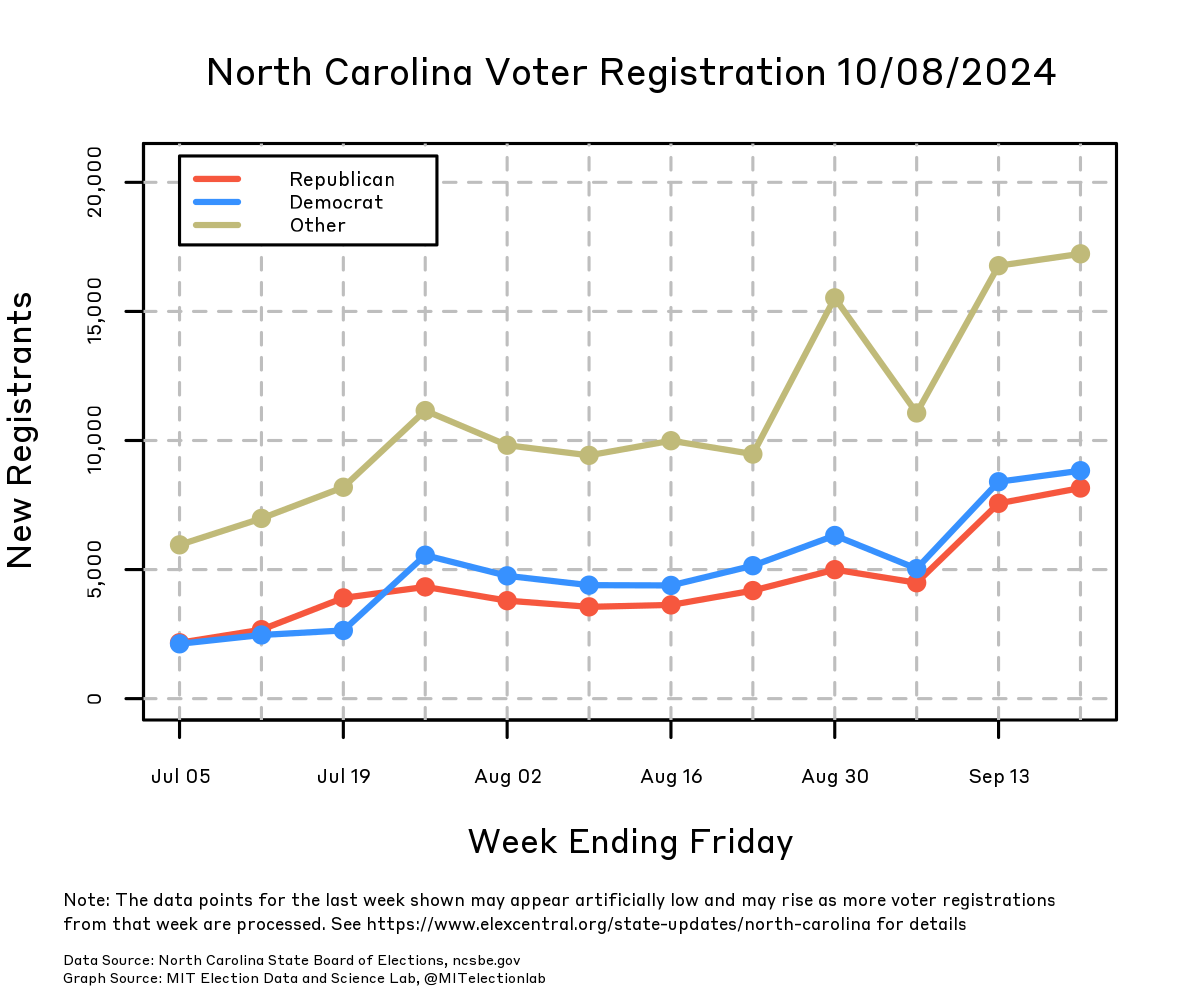
October 8, 2024
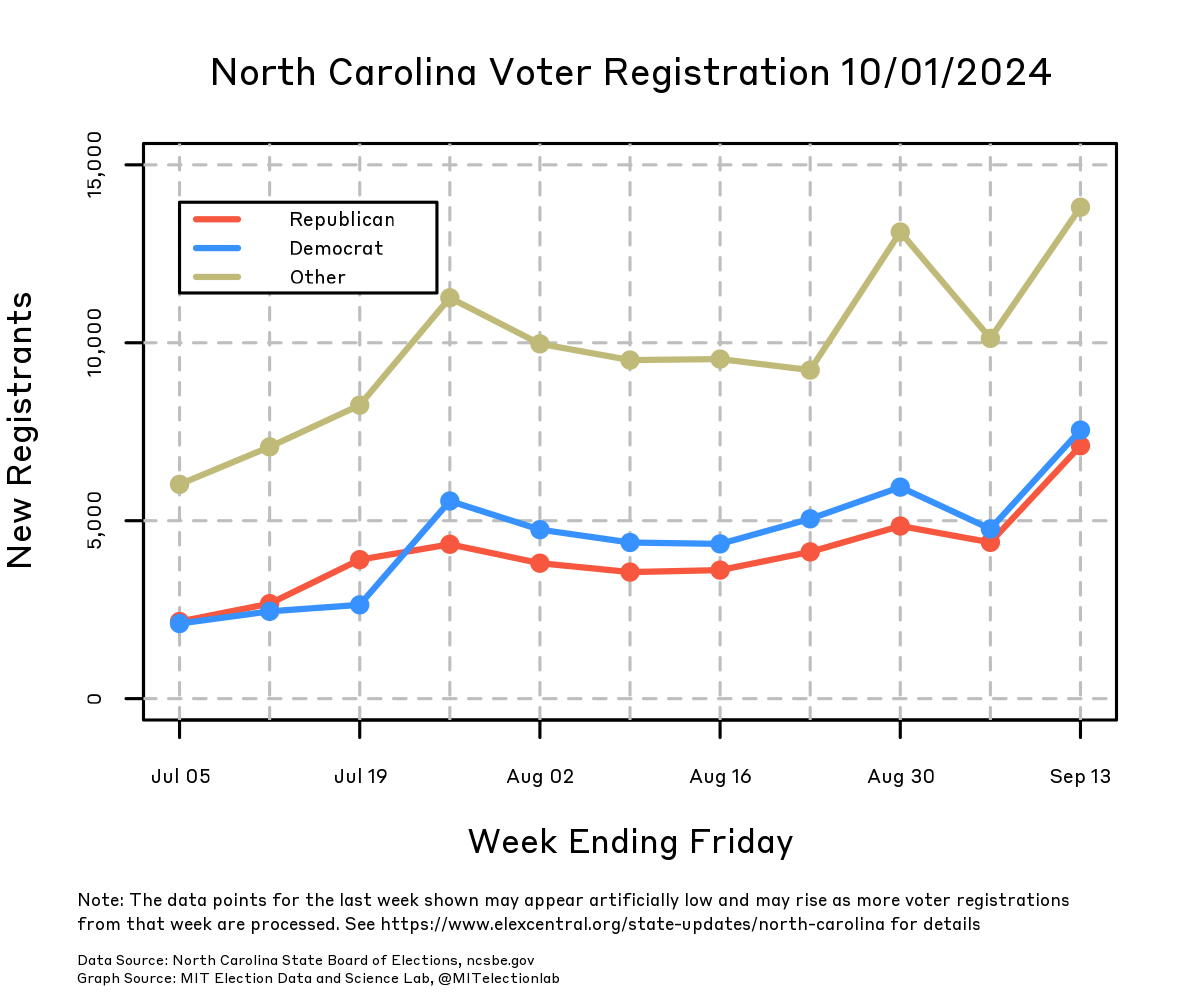
October 1, 2024
September 25, 2024
September 18, 2024
September 11, 2024
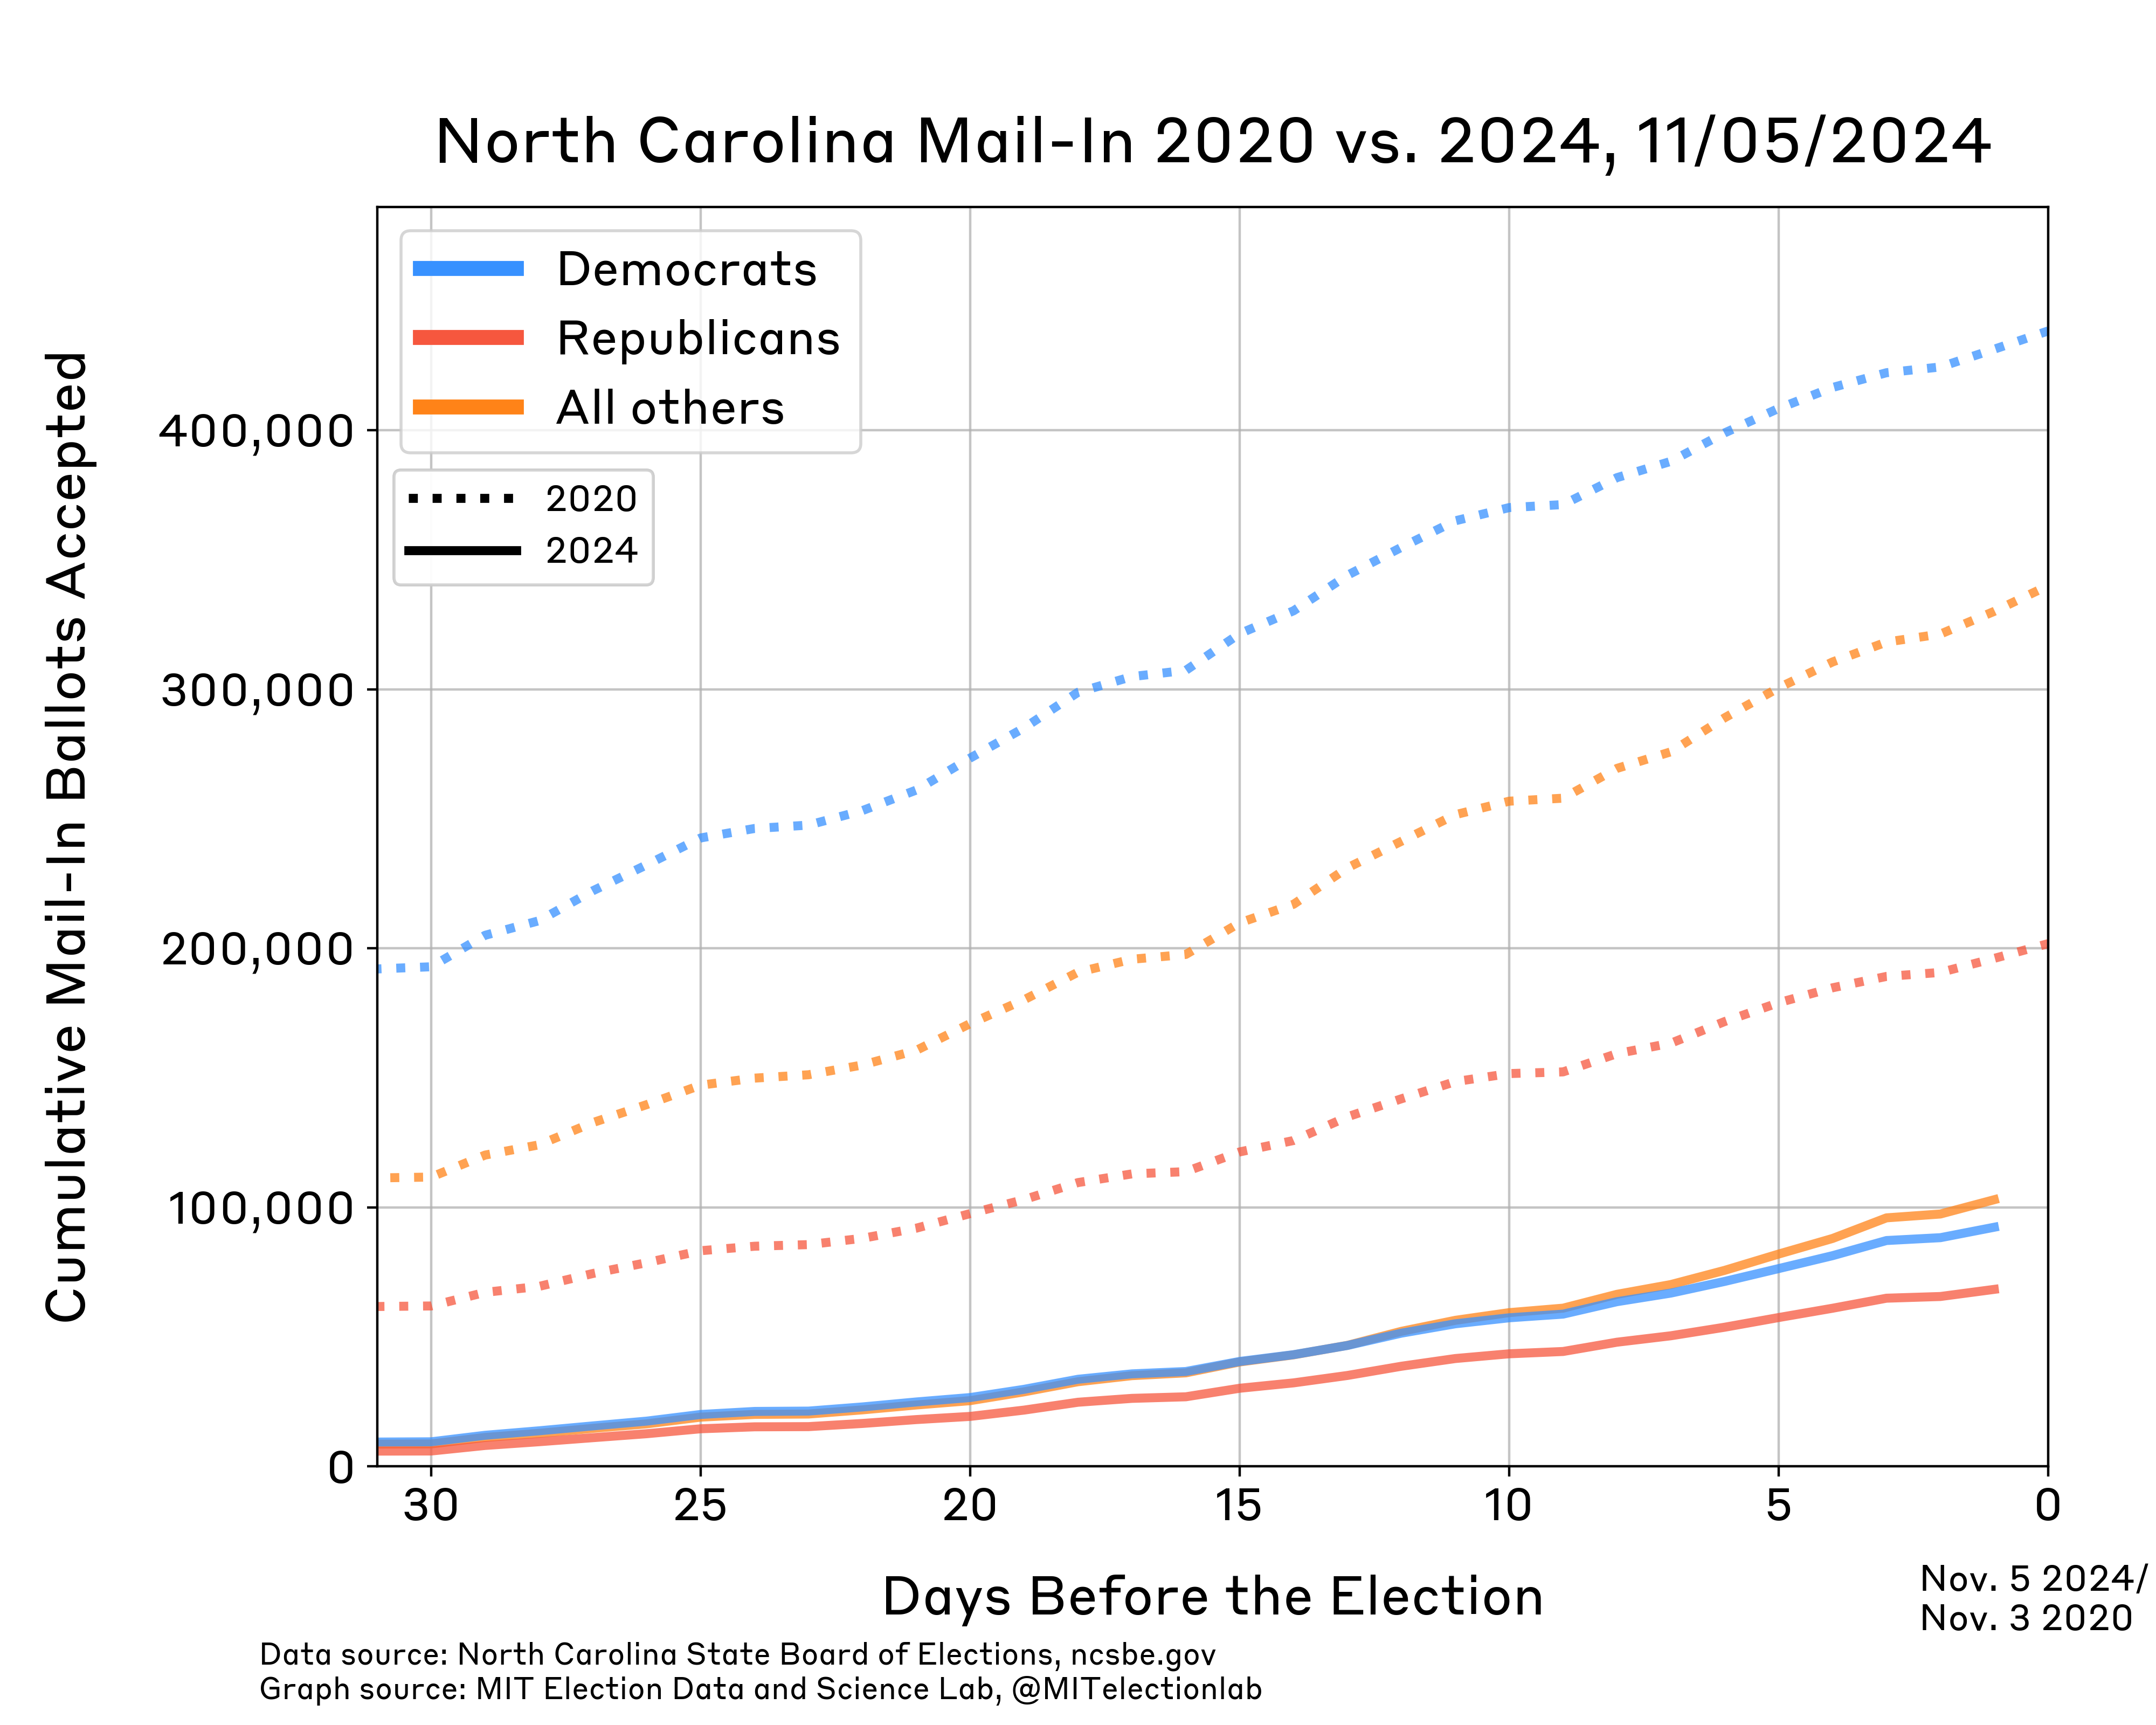
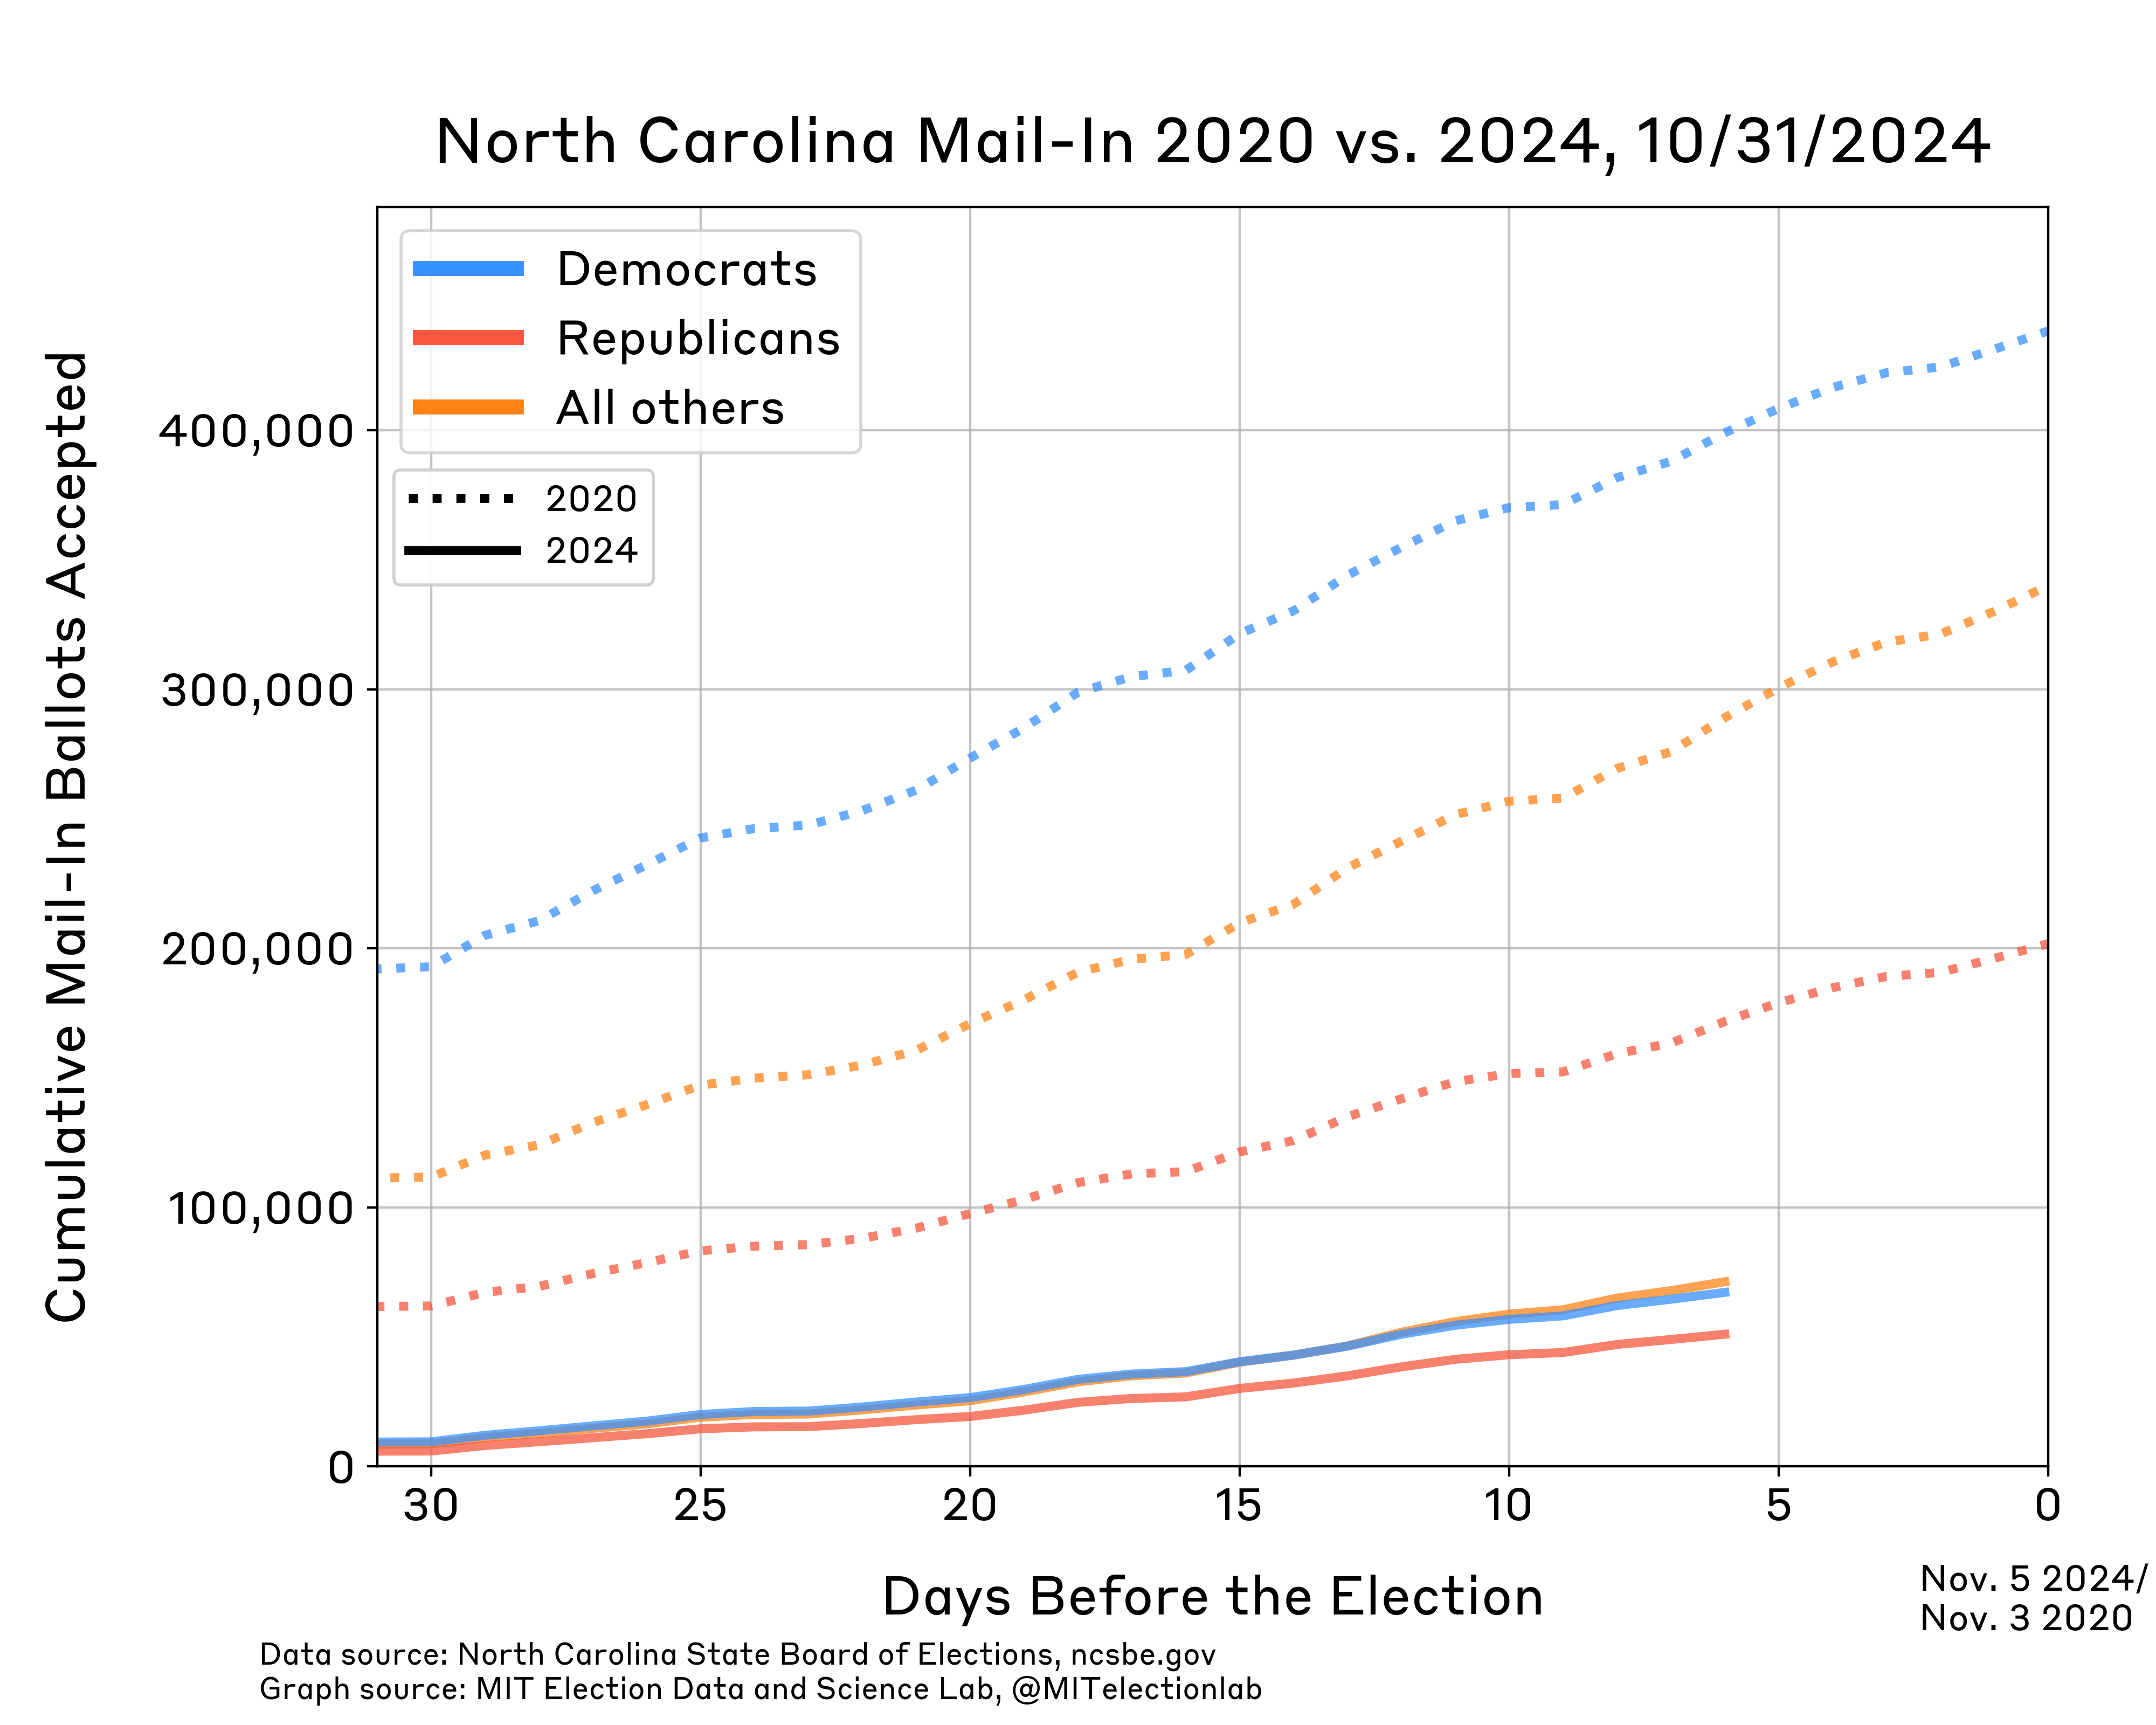
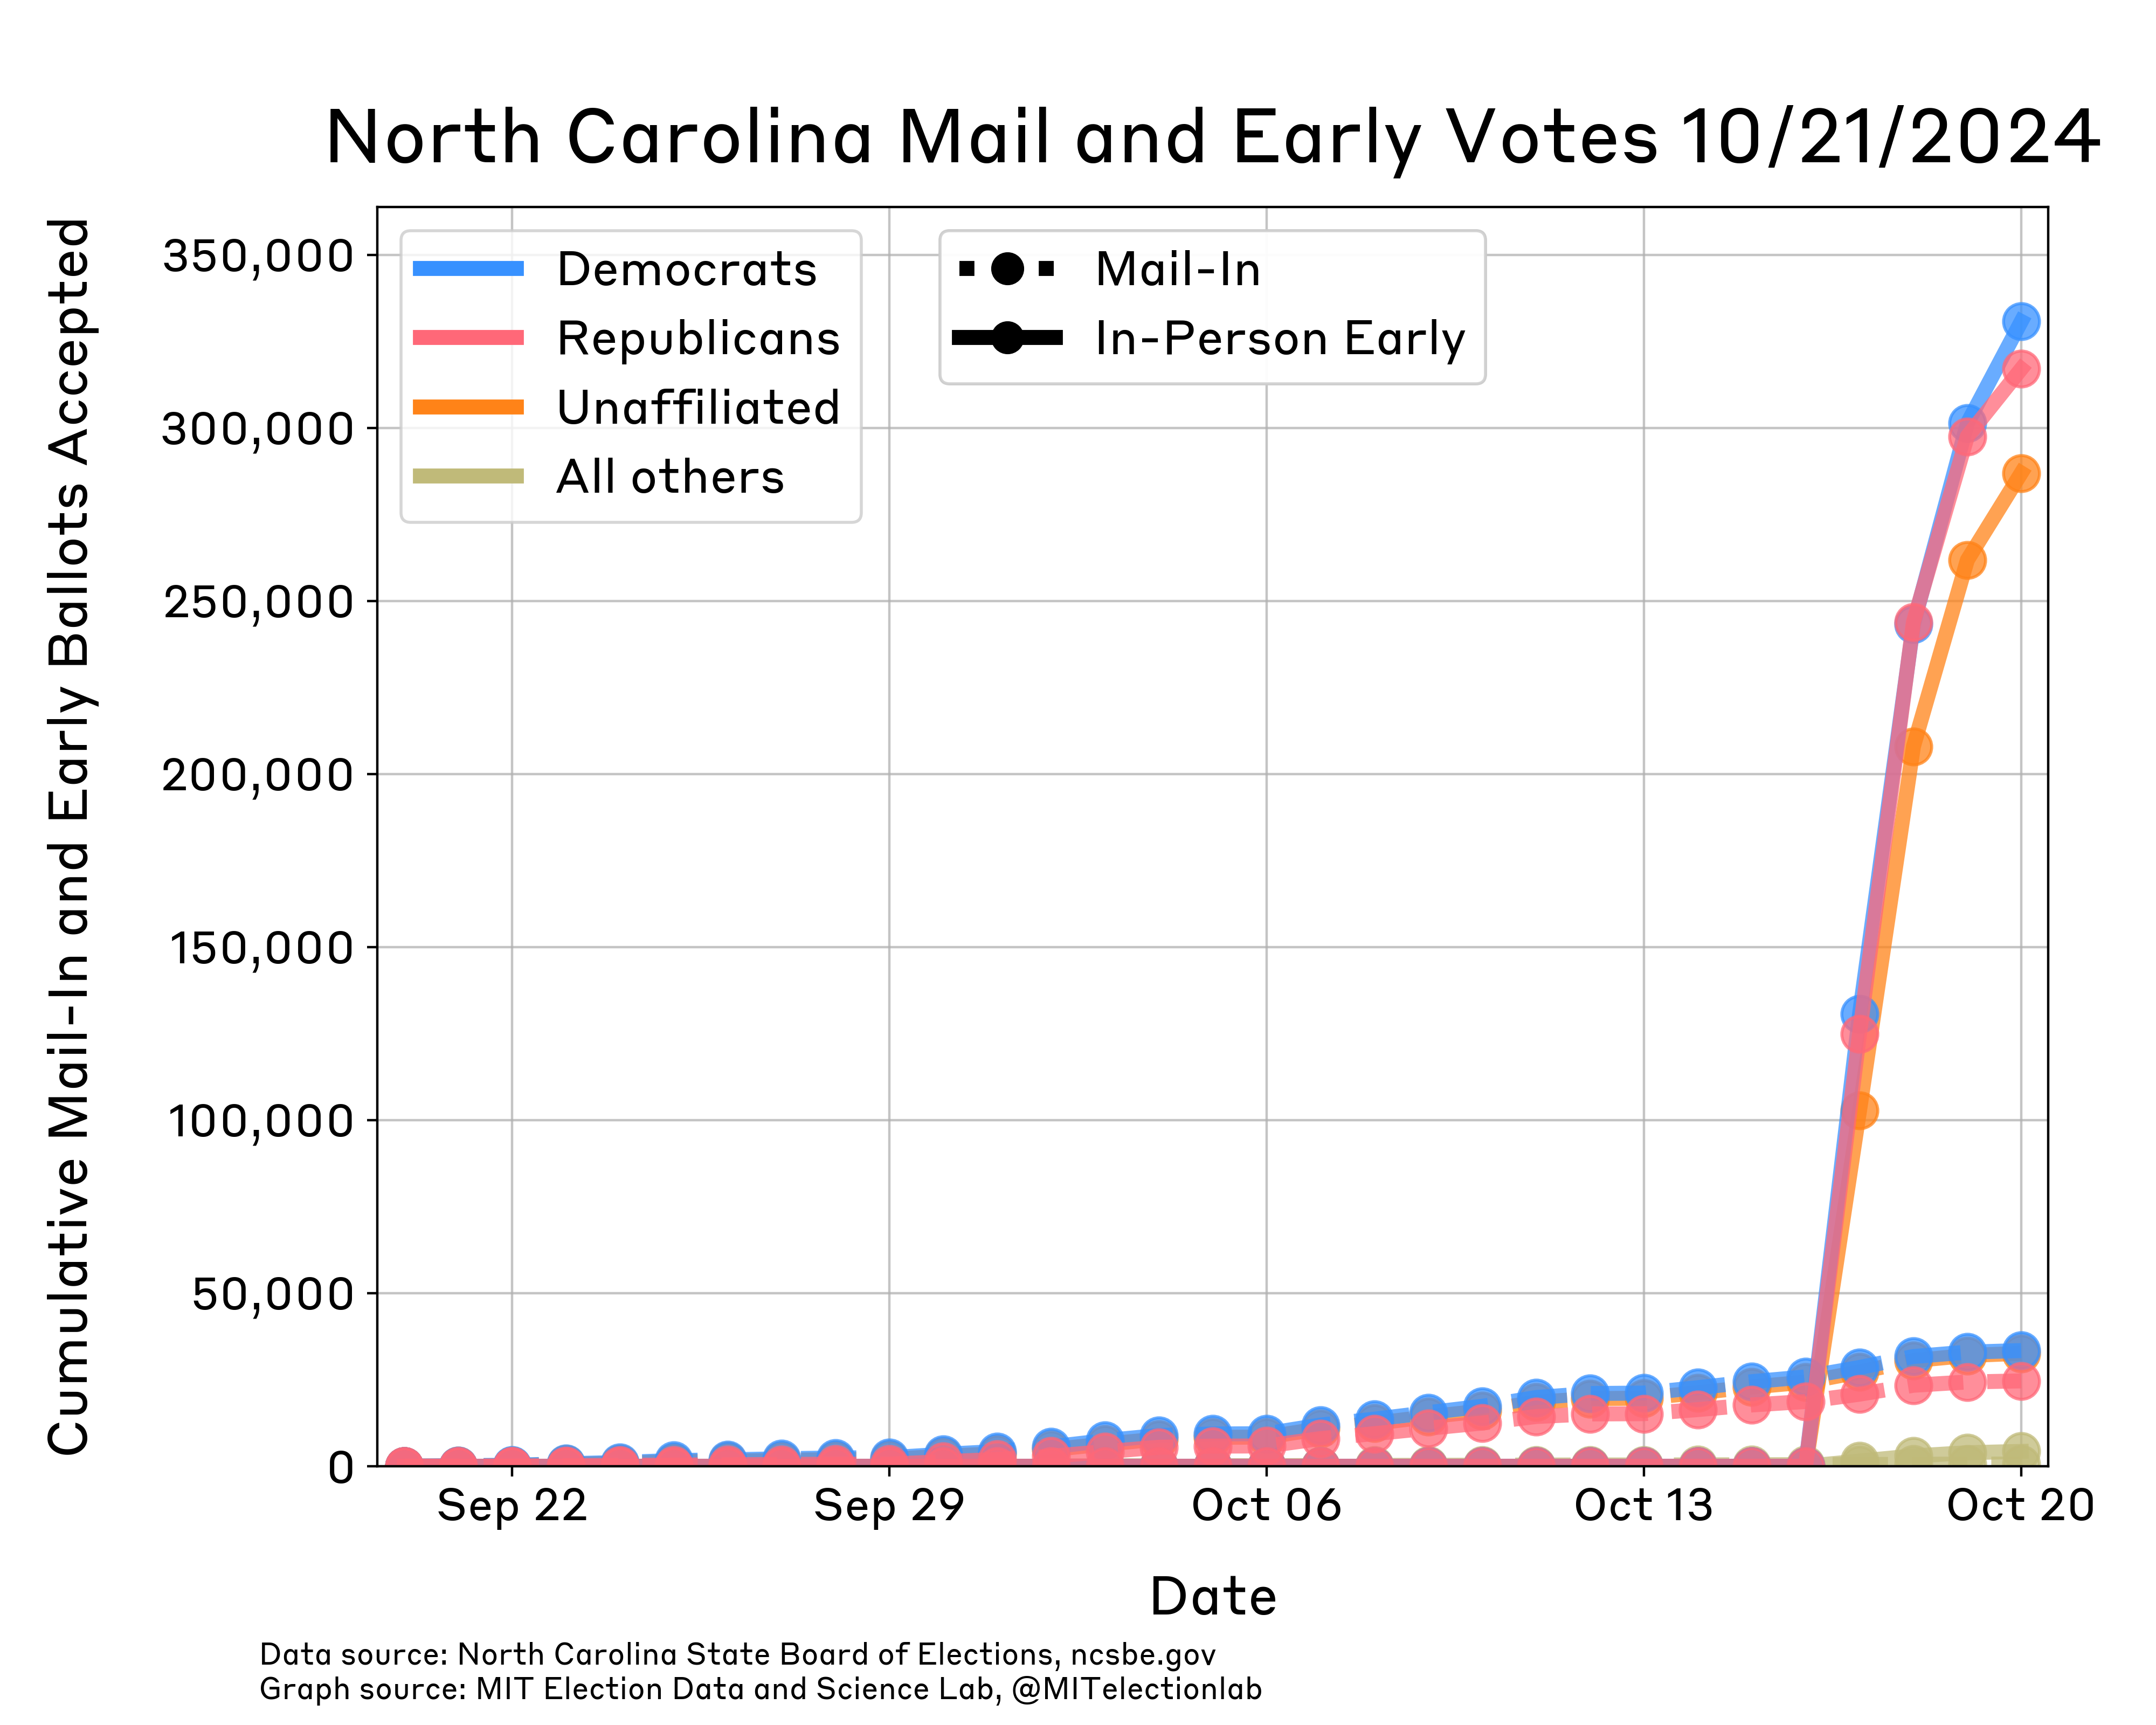
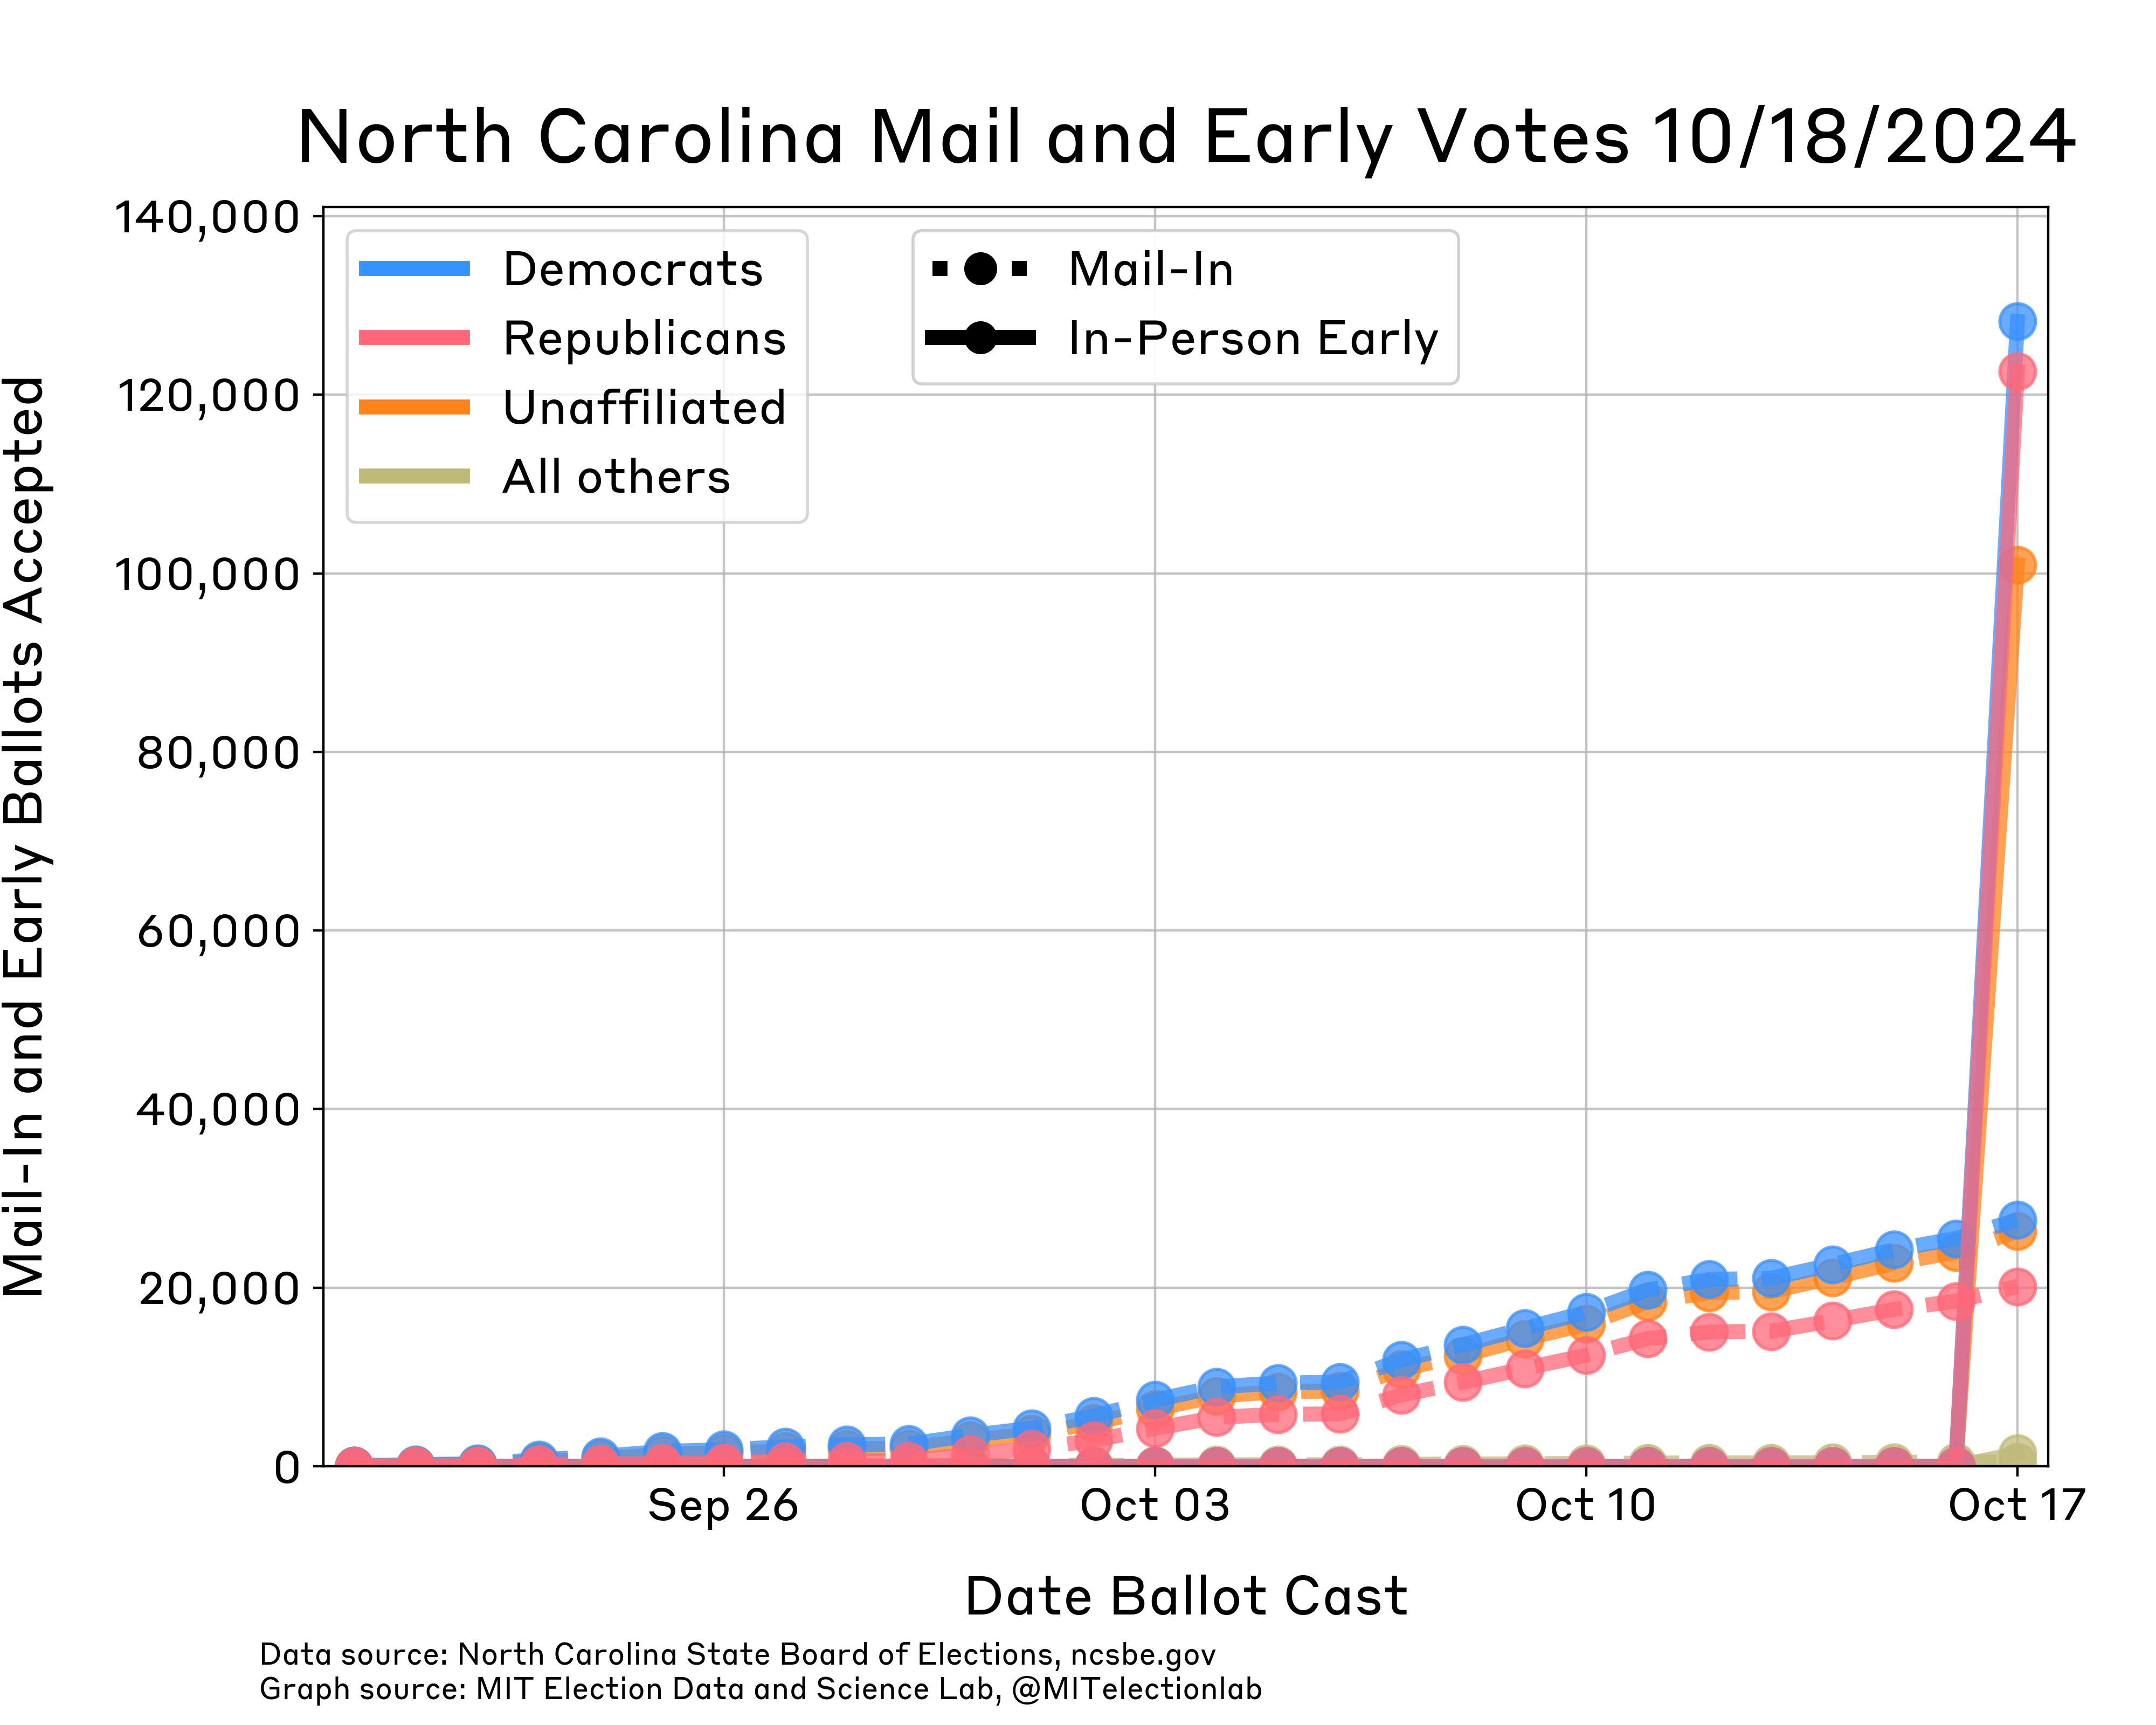
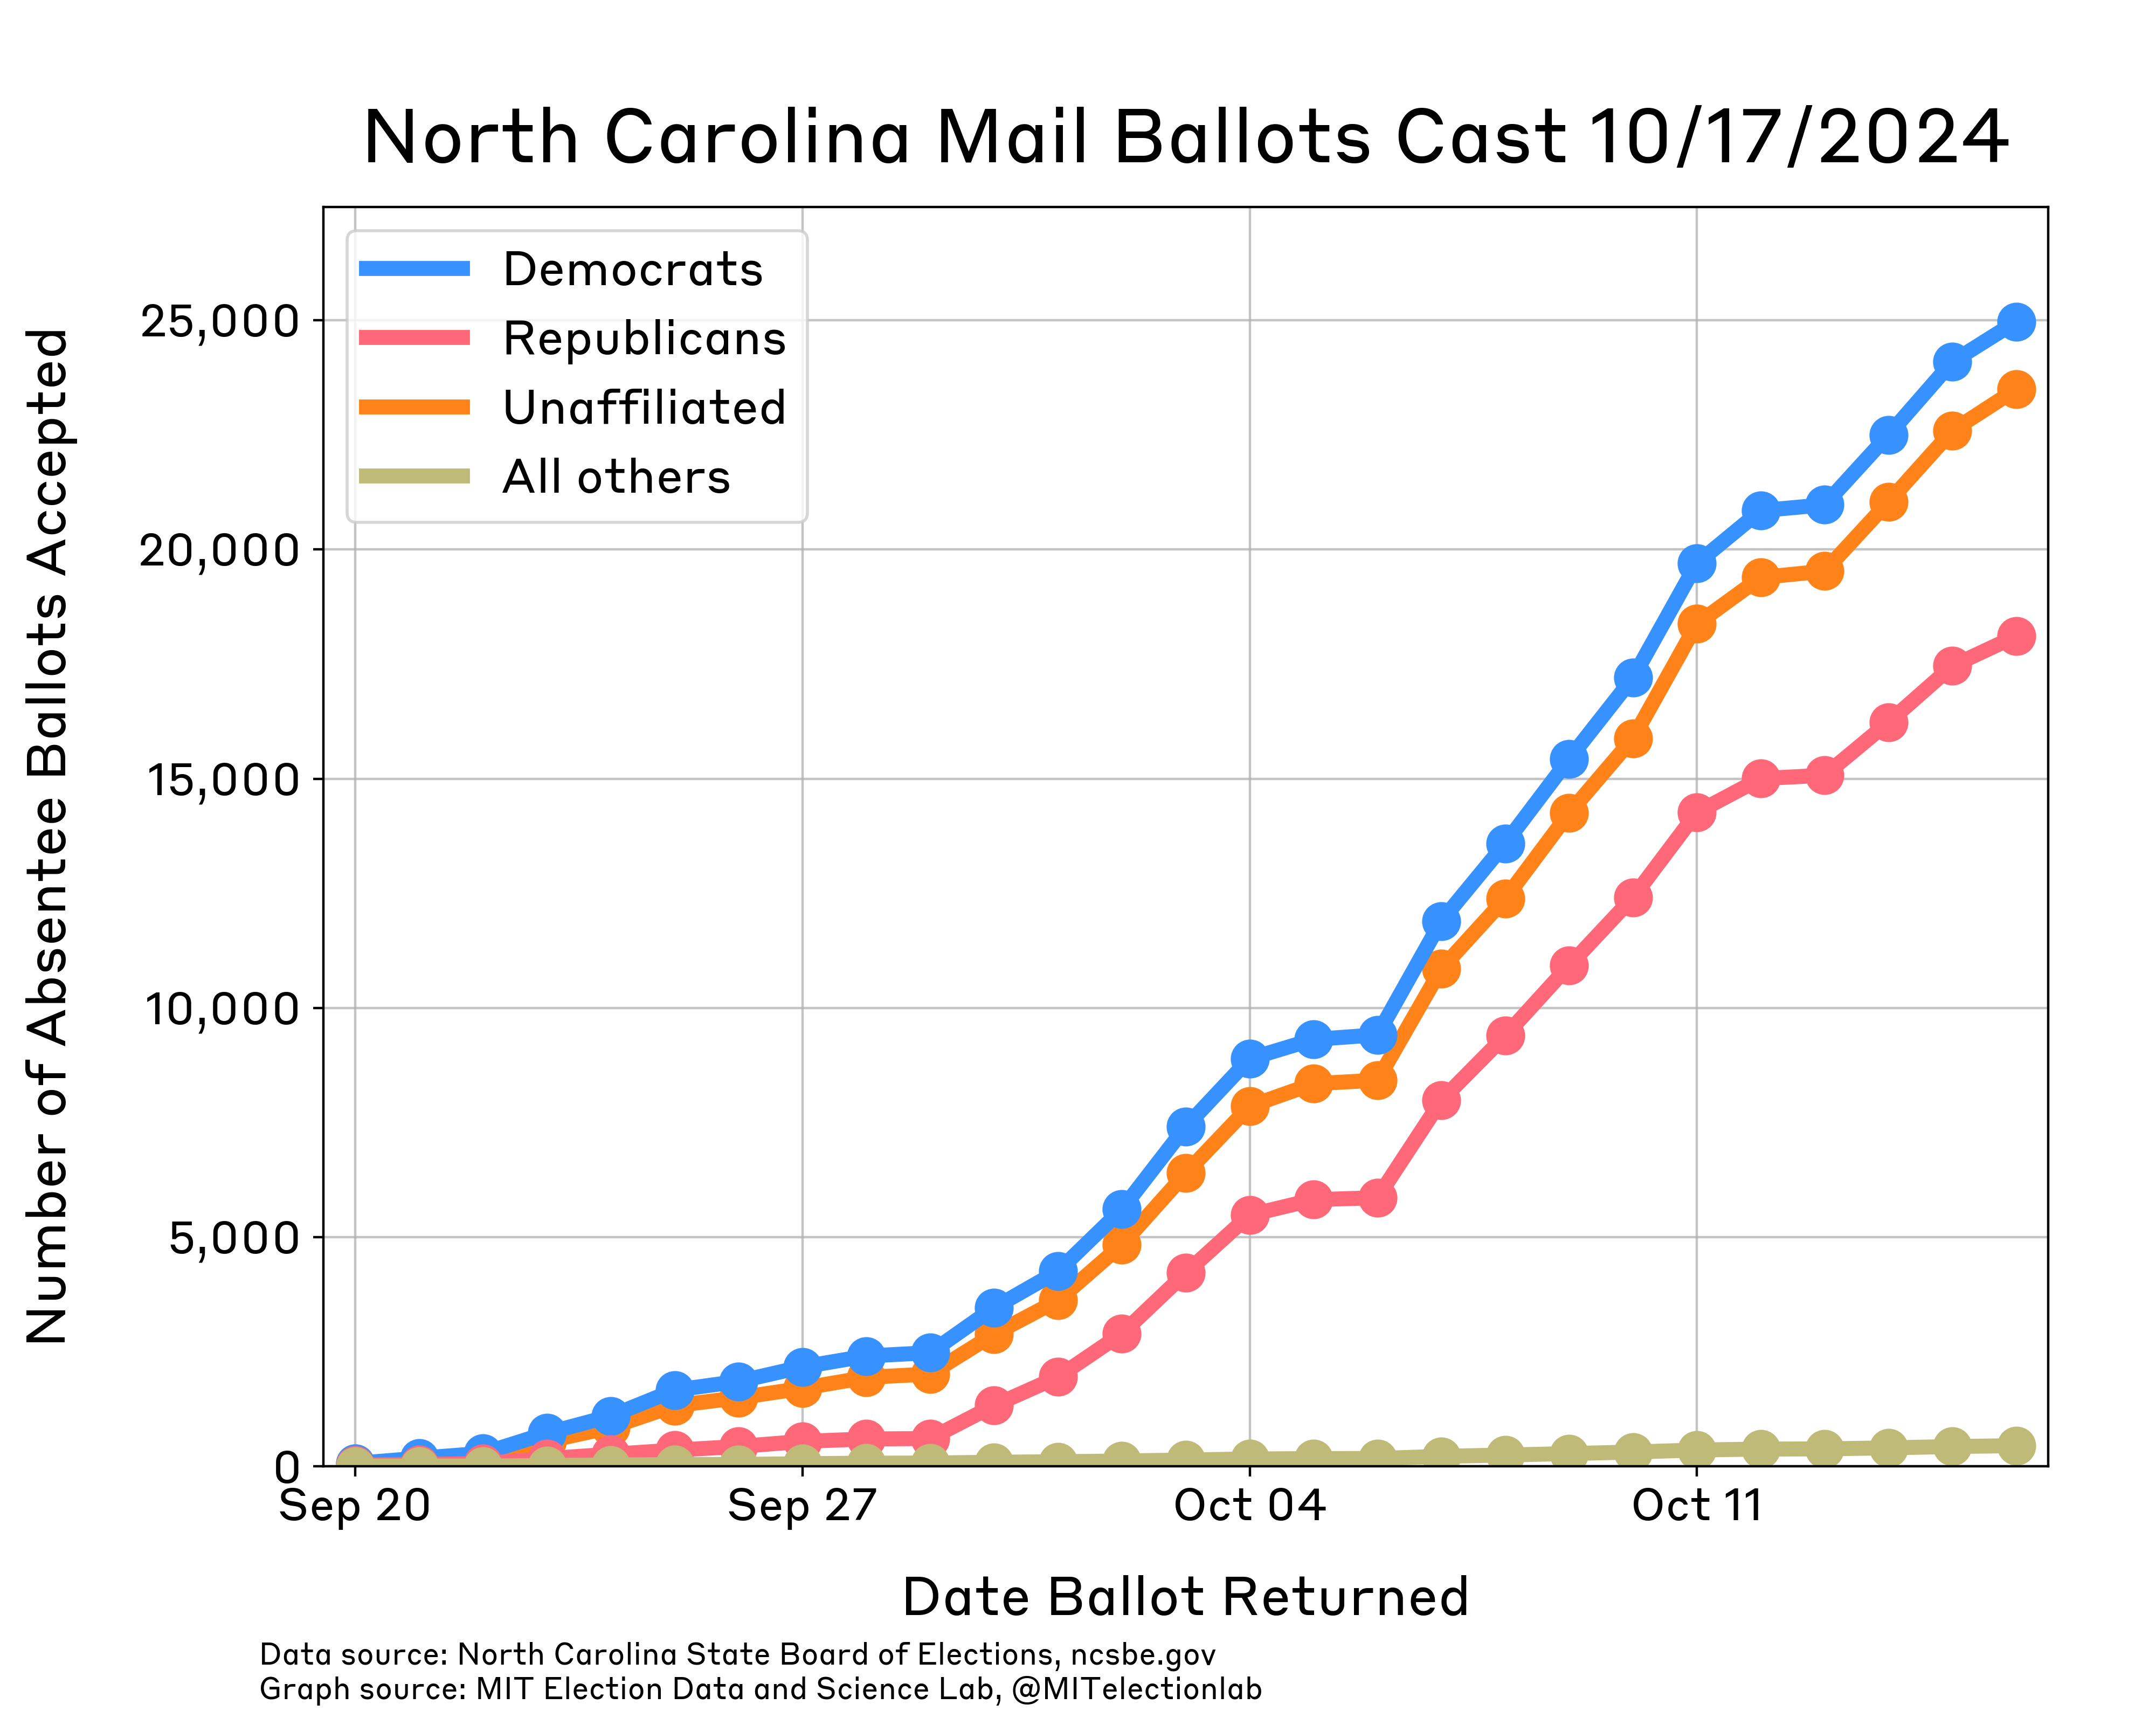
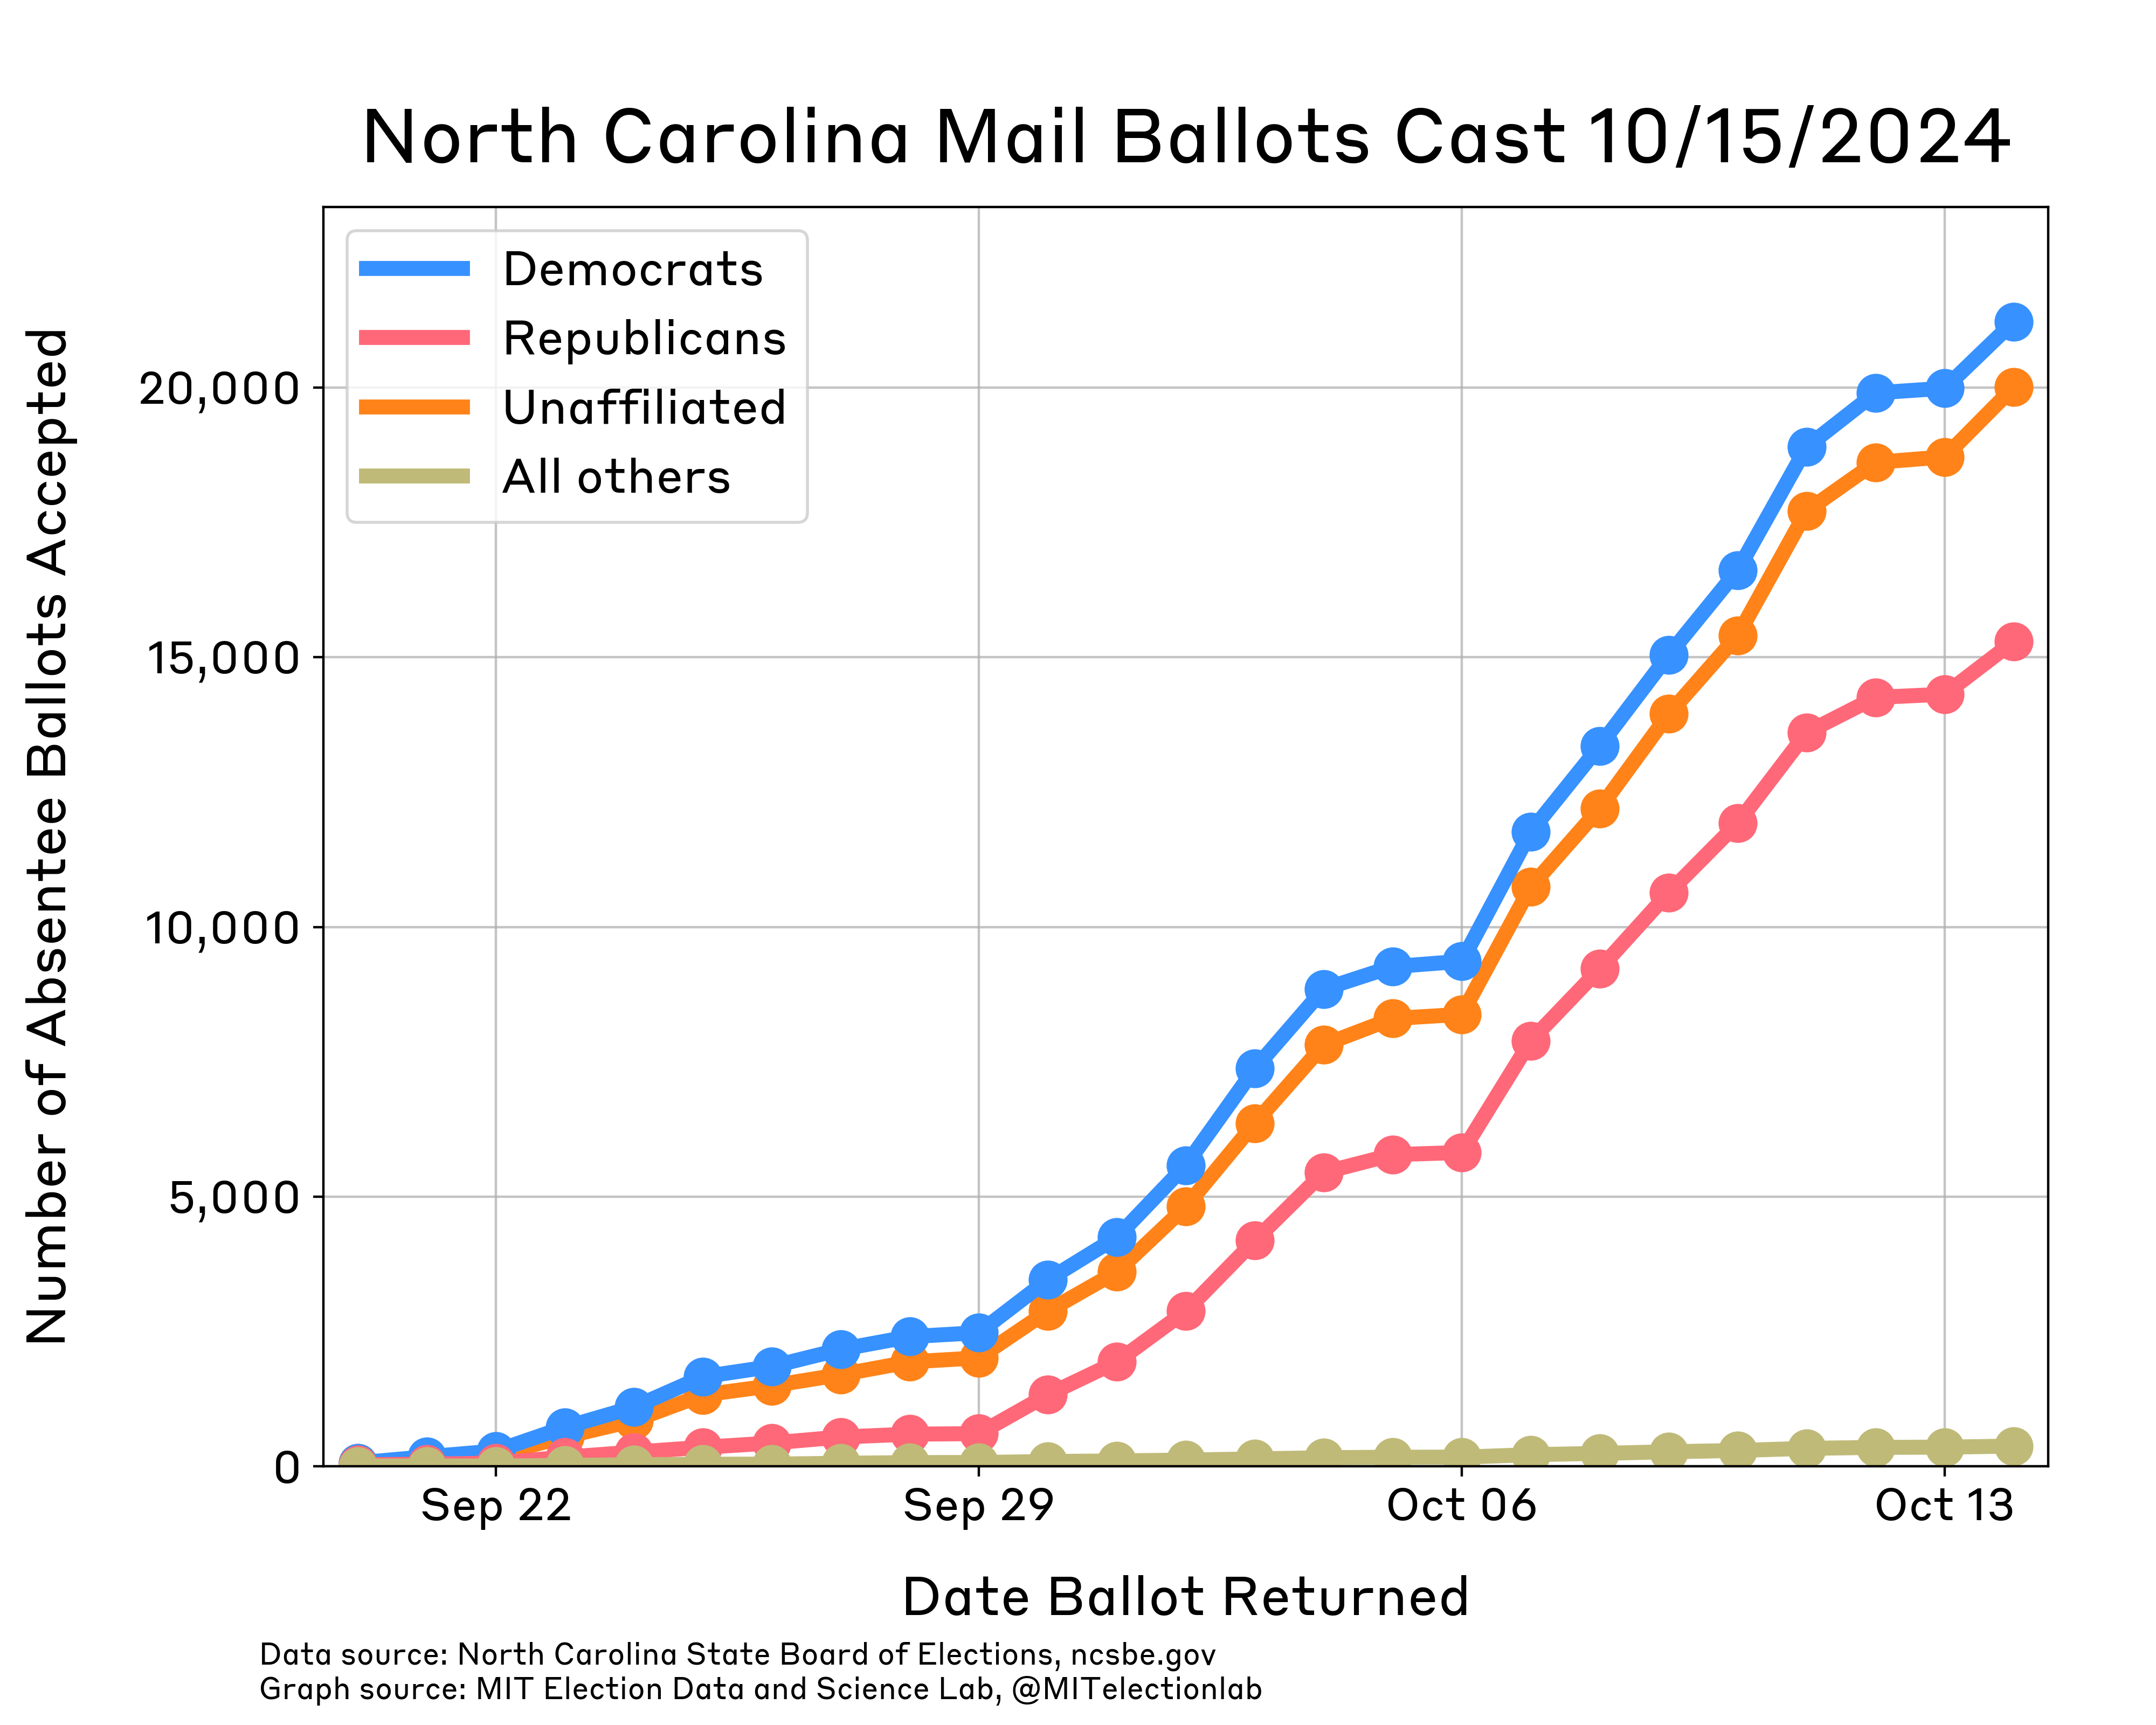
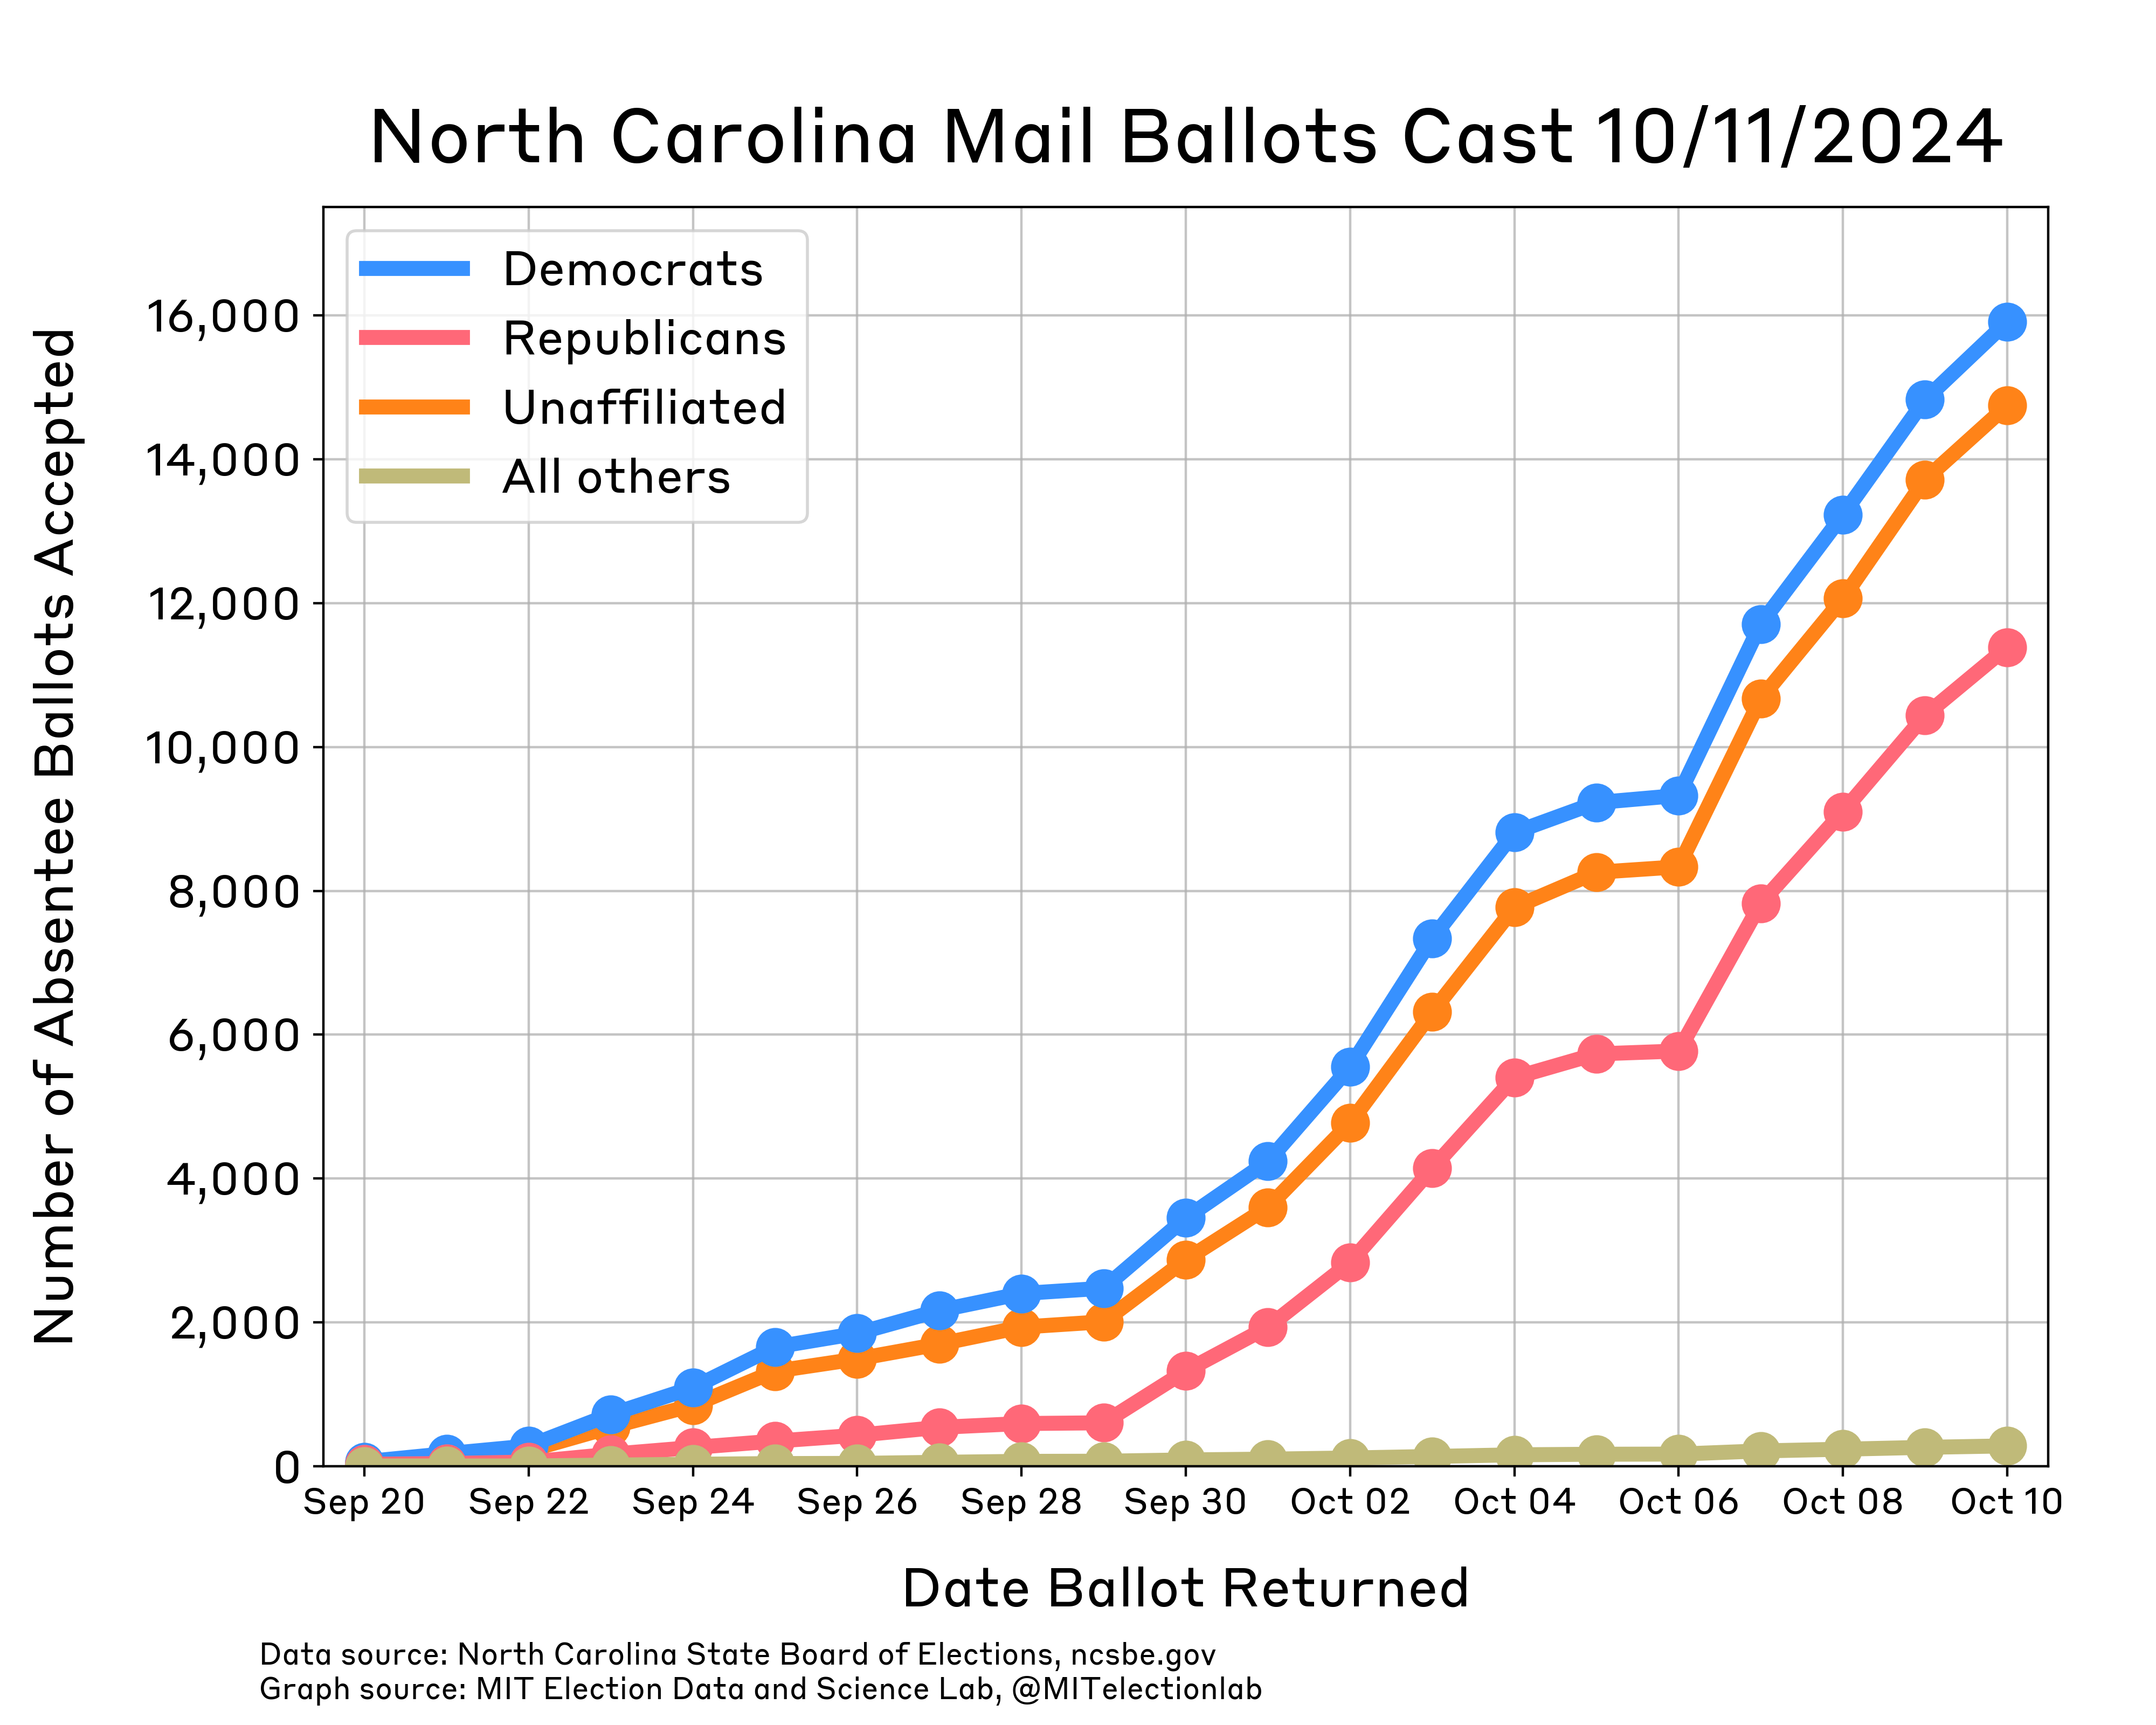
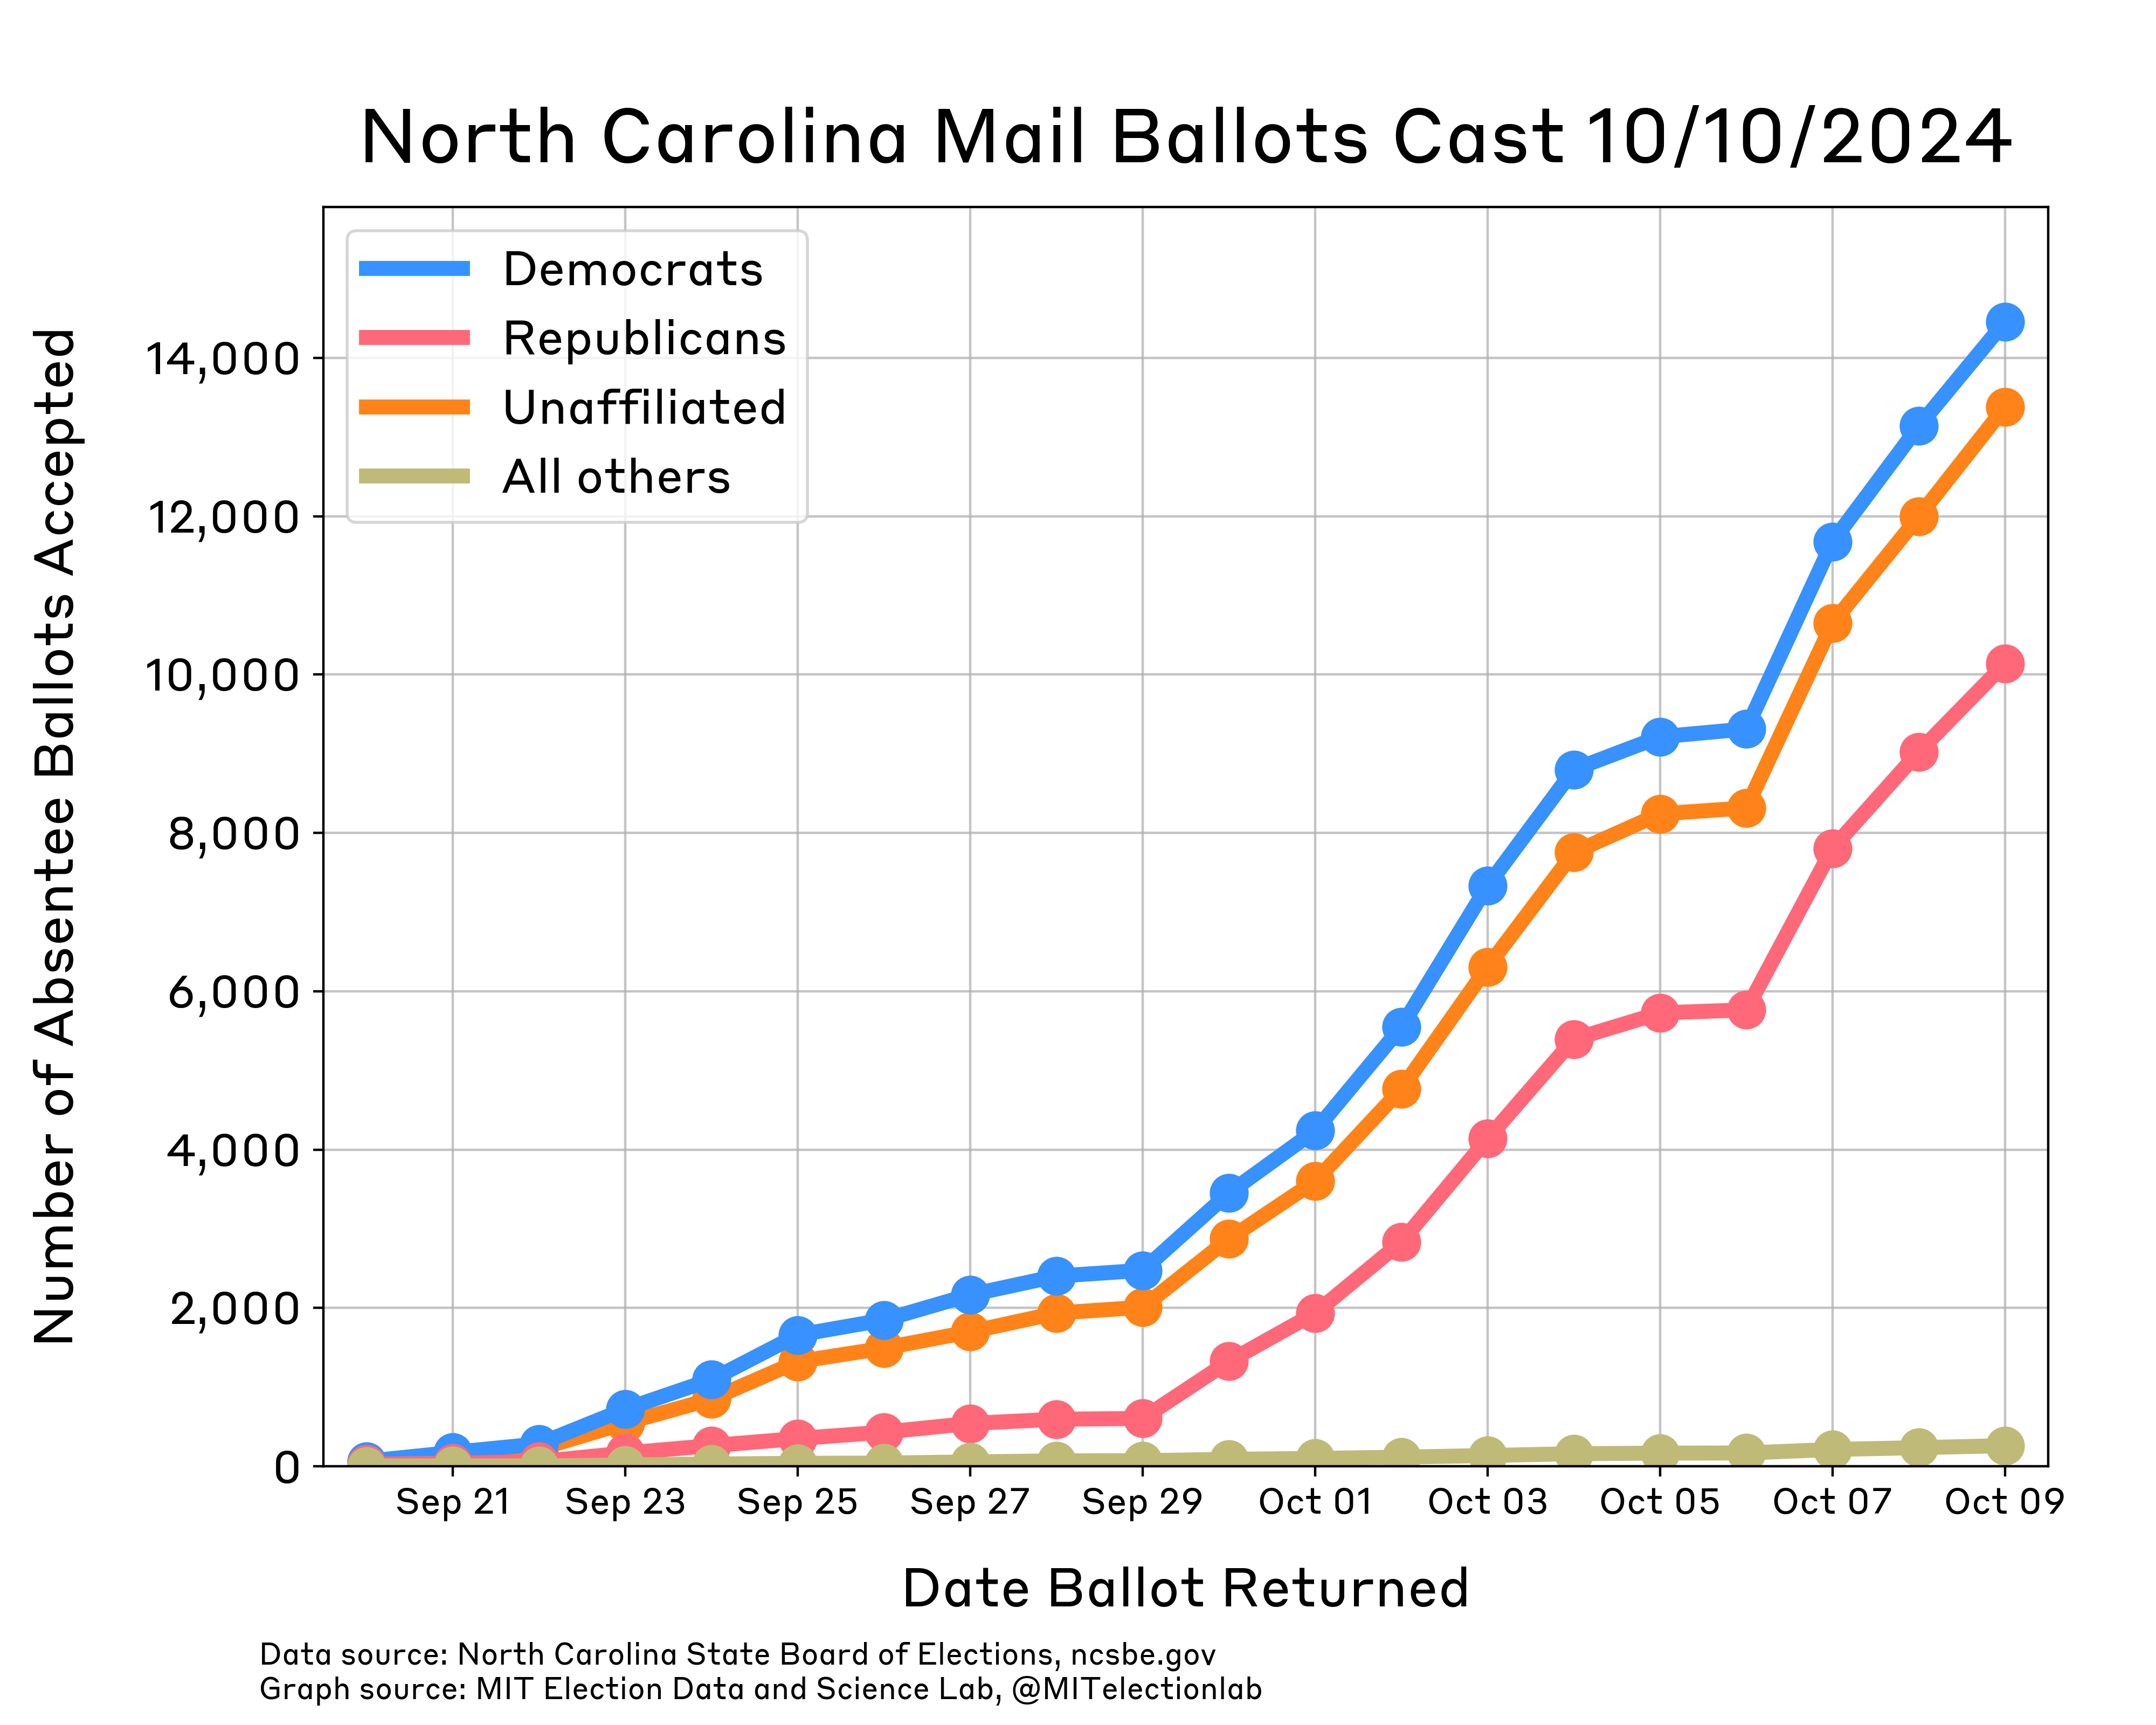
Mail Ballots Cast
Last updated November 5, 2024
November 4, 2024

November 1, 2024

October 31, 2024
October 29, 2024

October 21, 2024
October 18, 2024
October 17, 2024
October 16, 2024

October 15, 2024
October 11, 2024
October 10, 2024
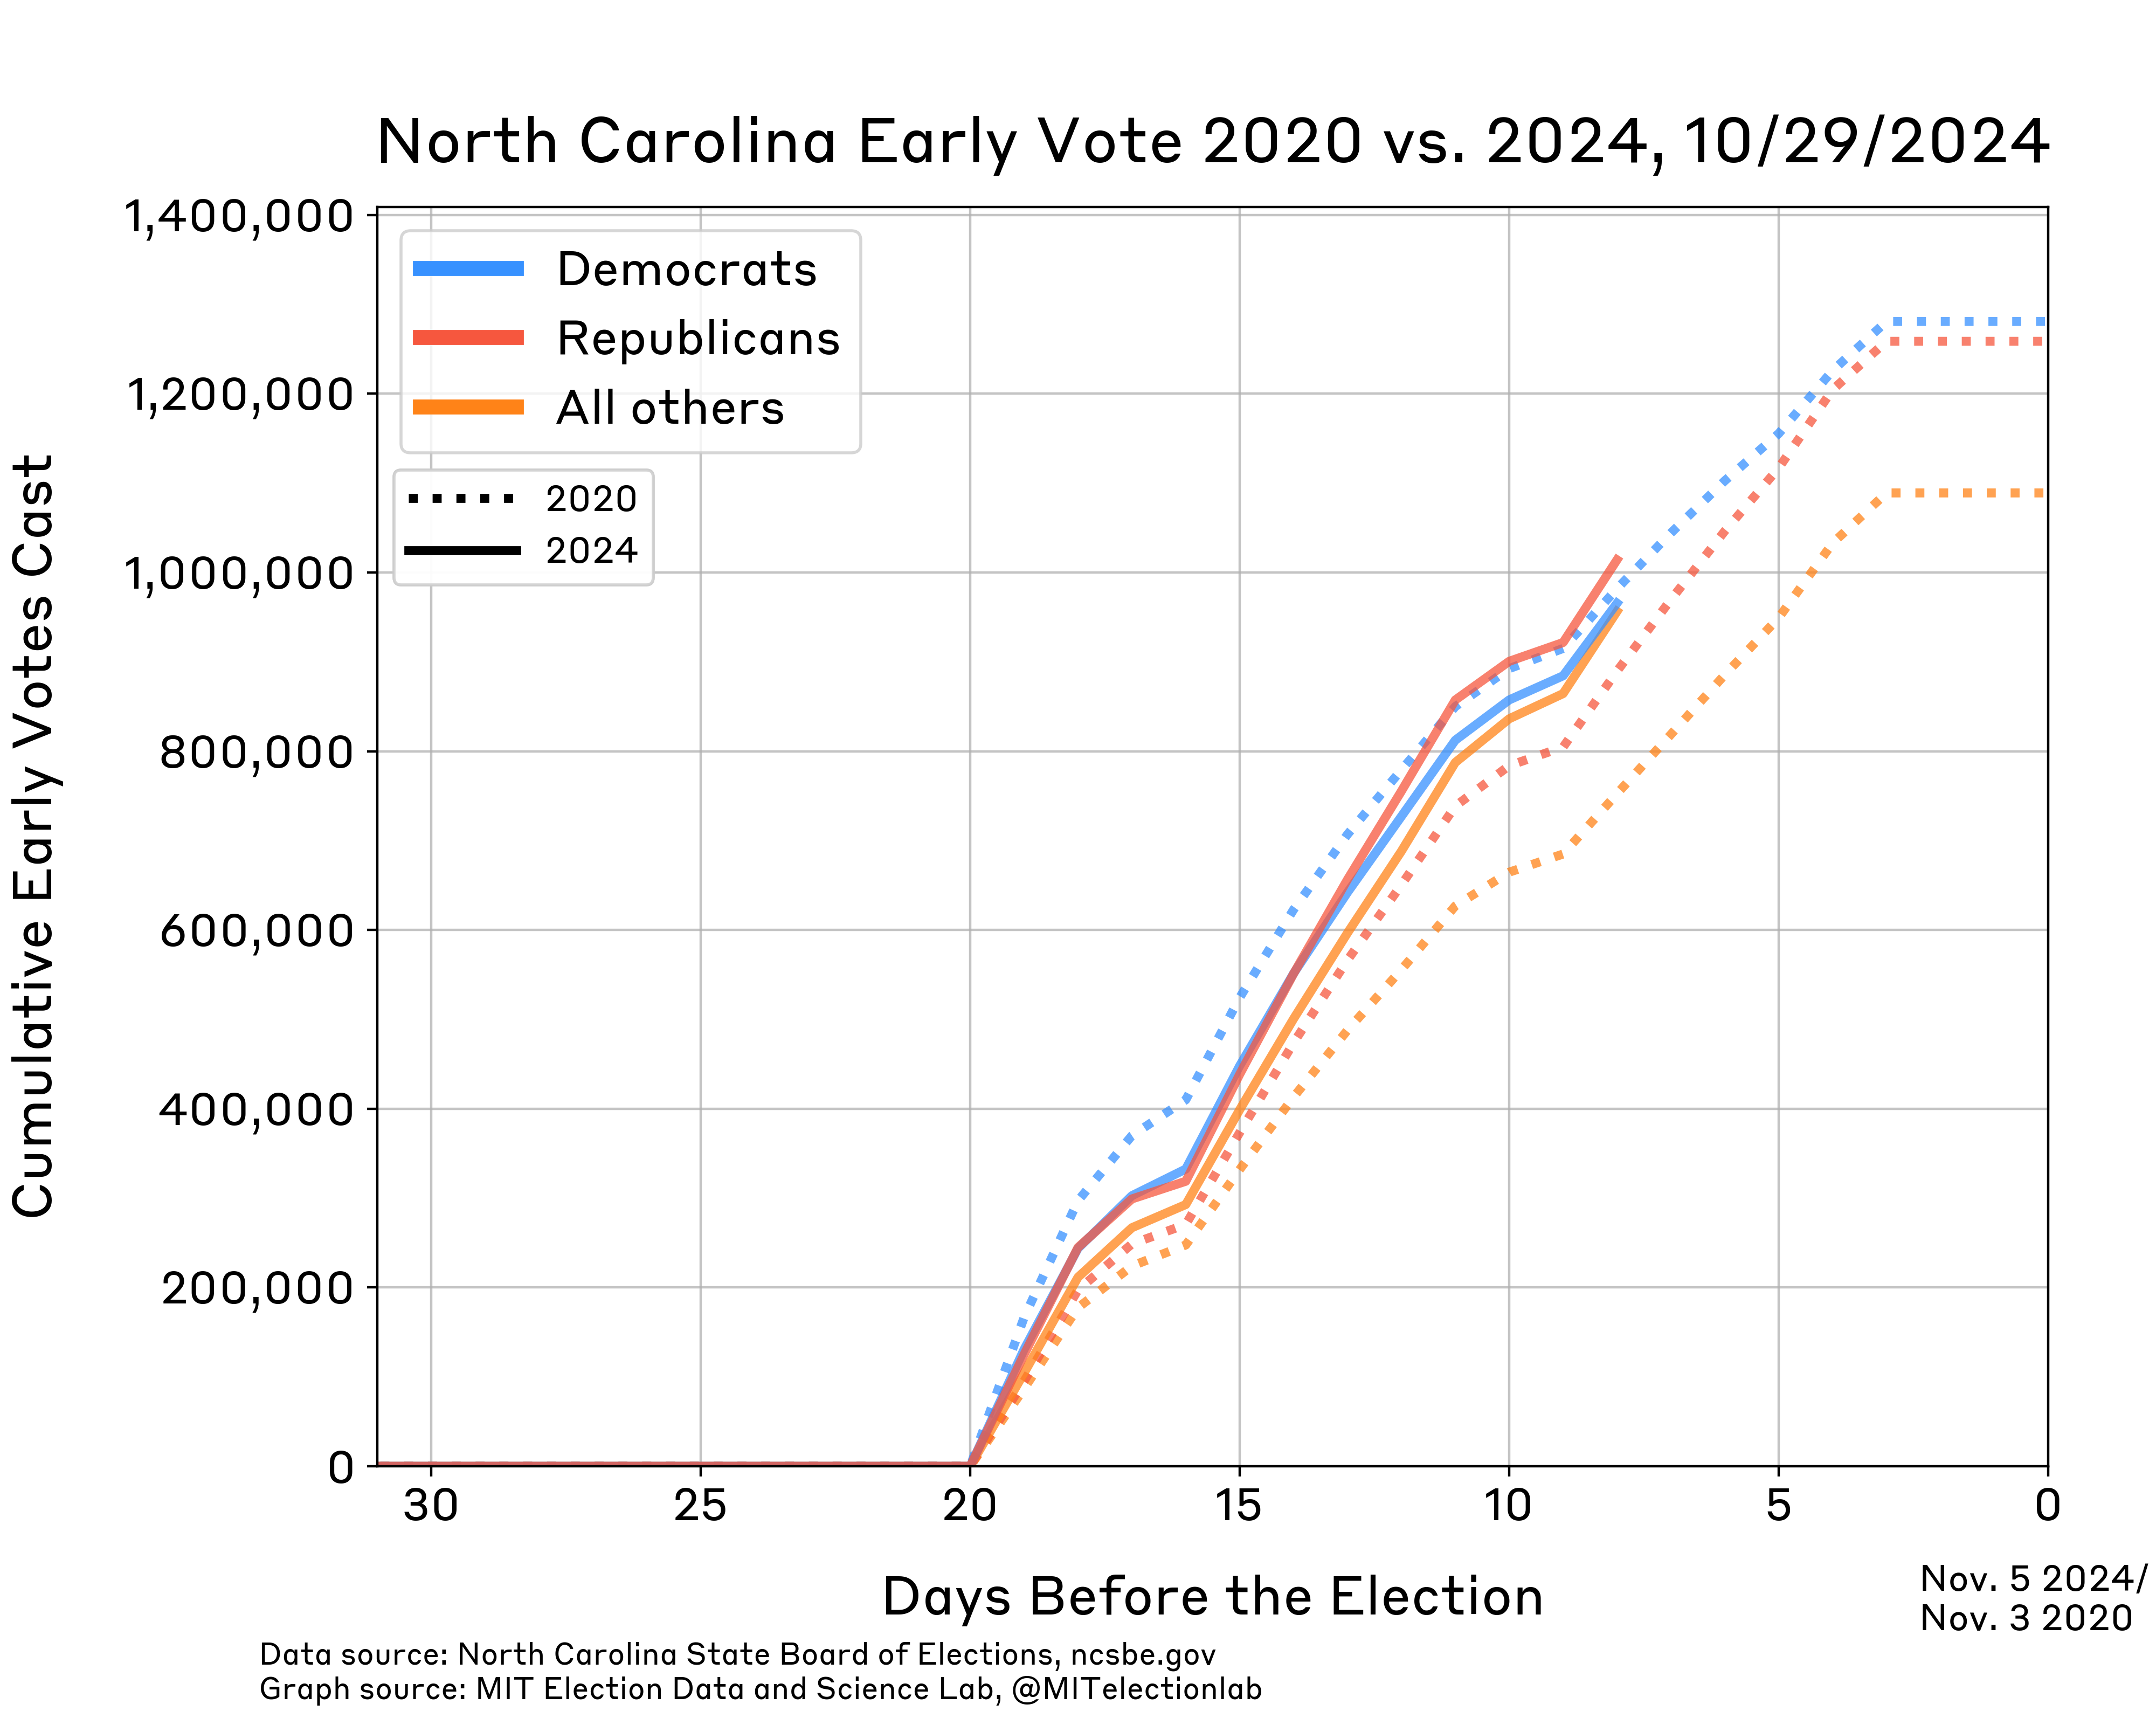
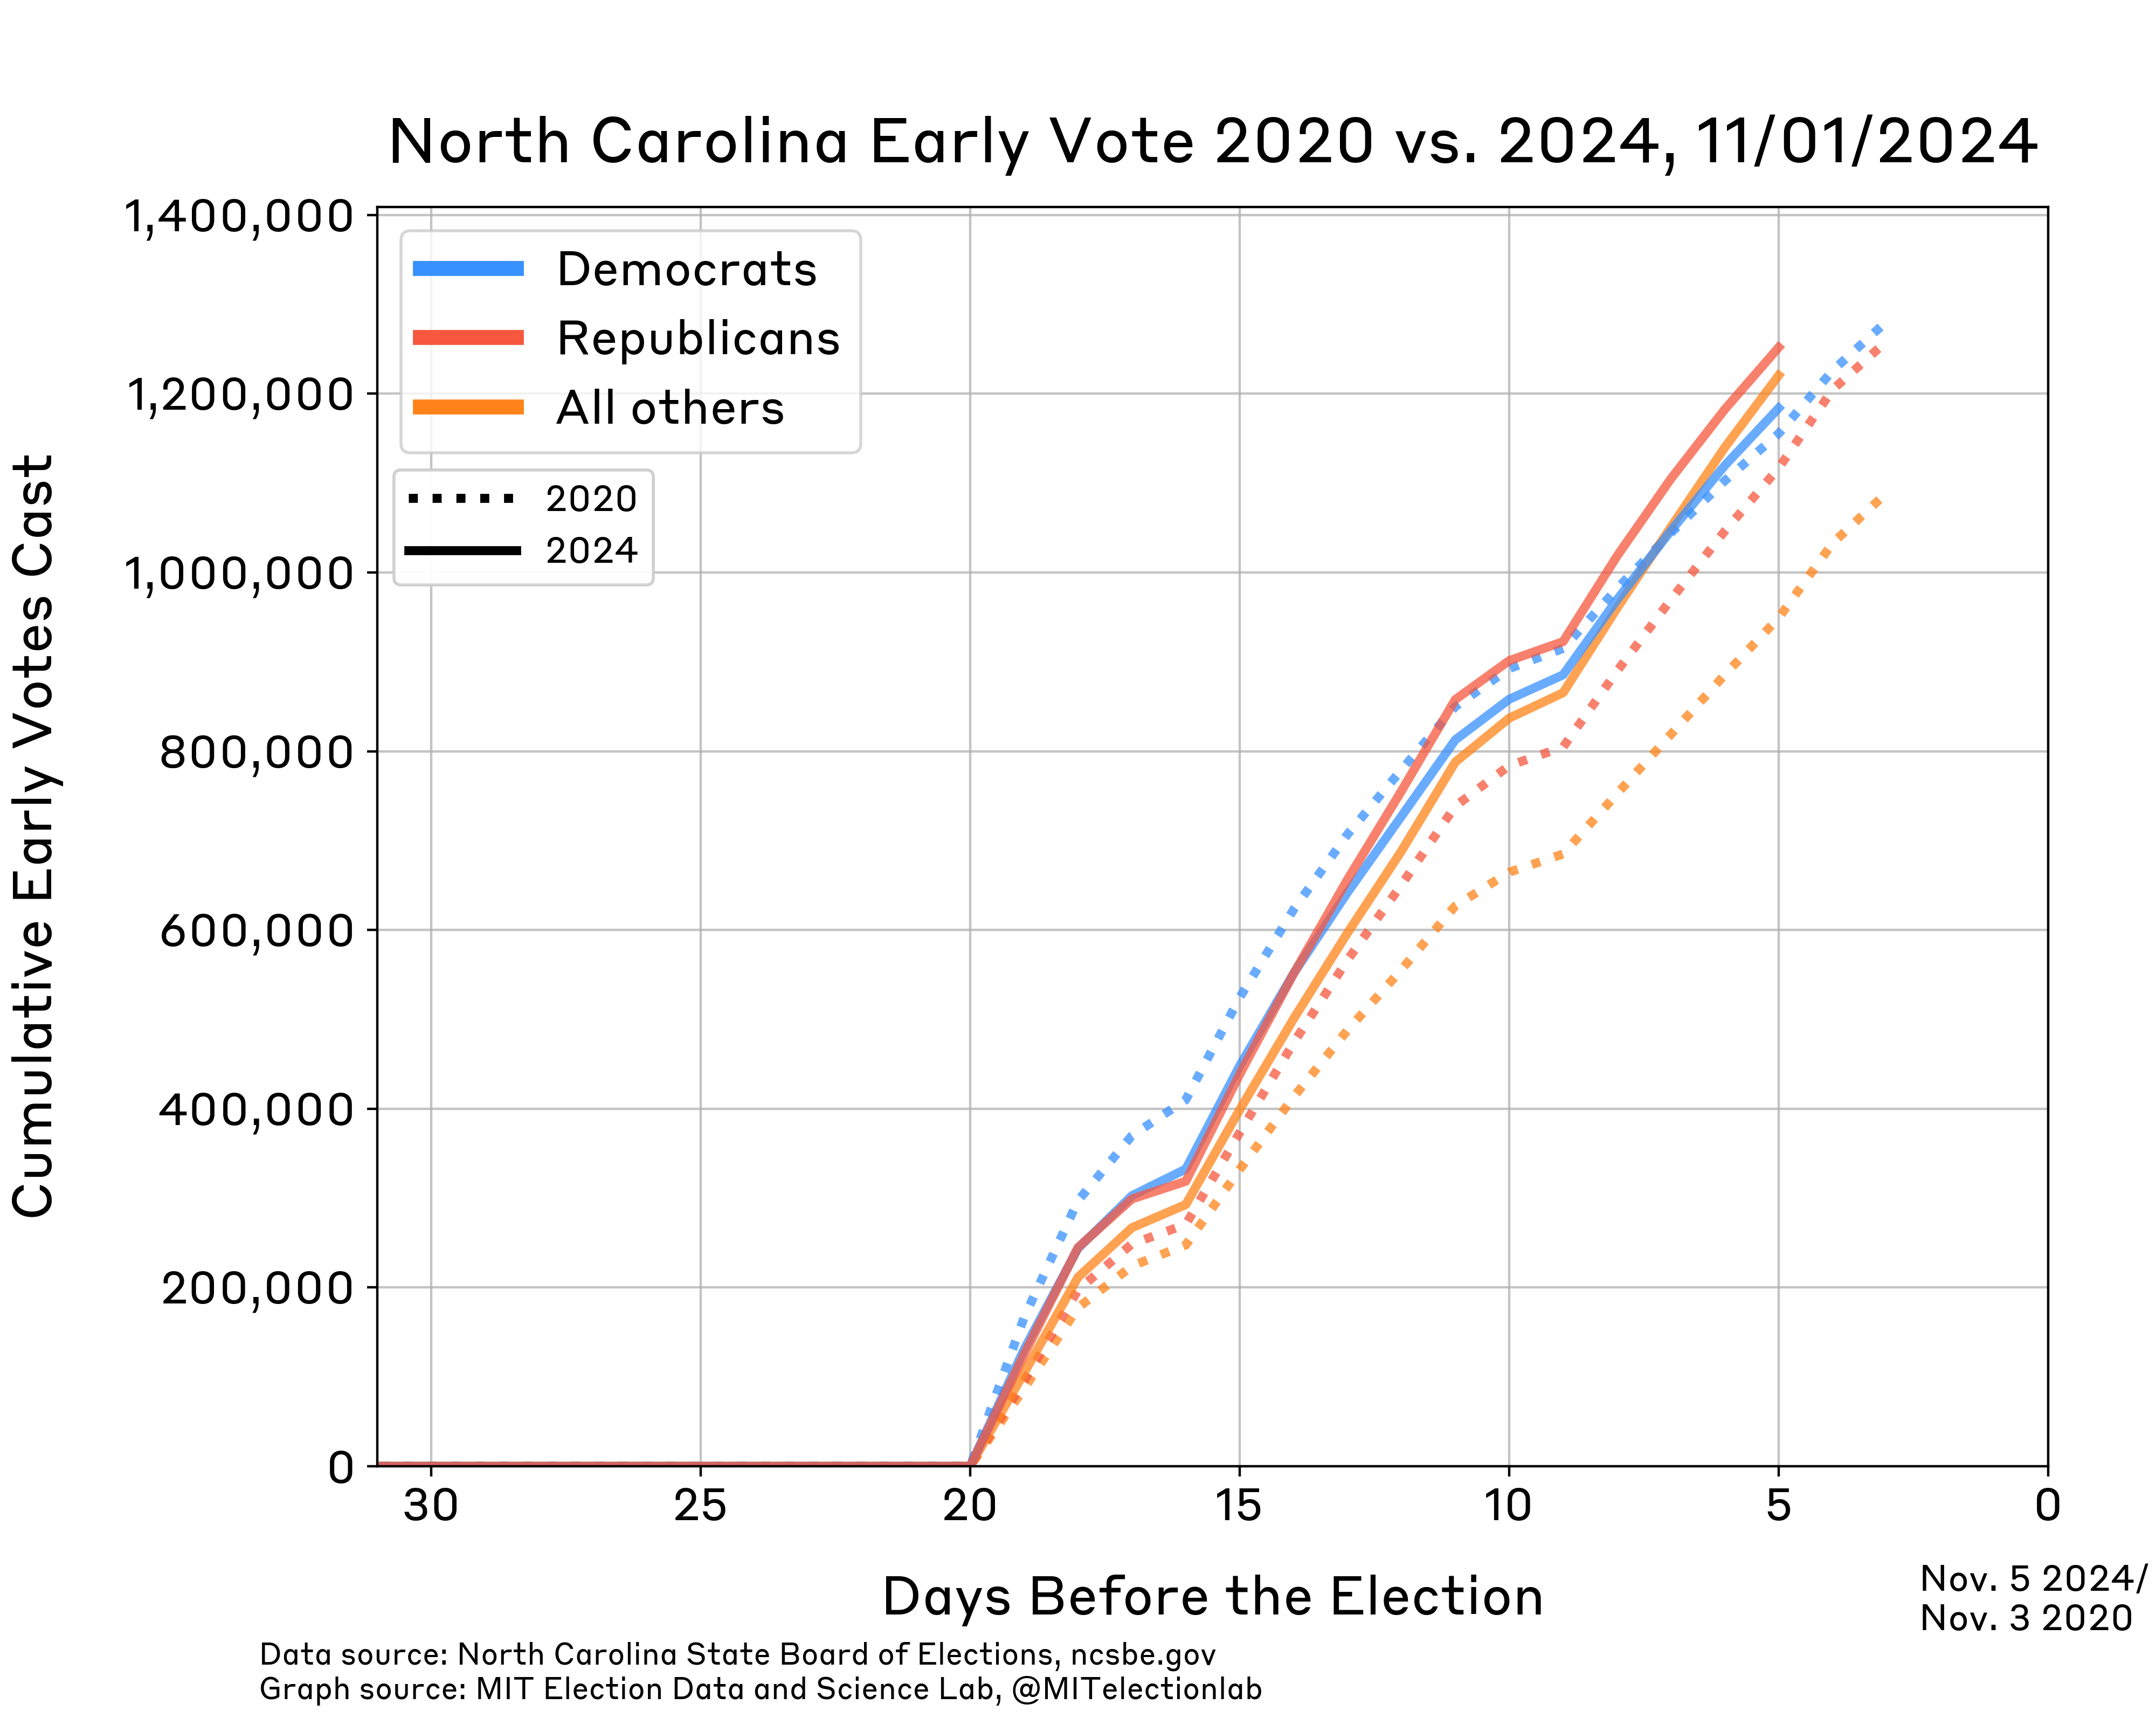
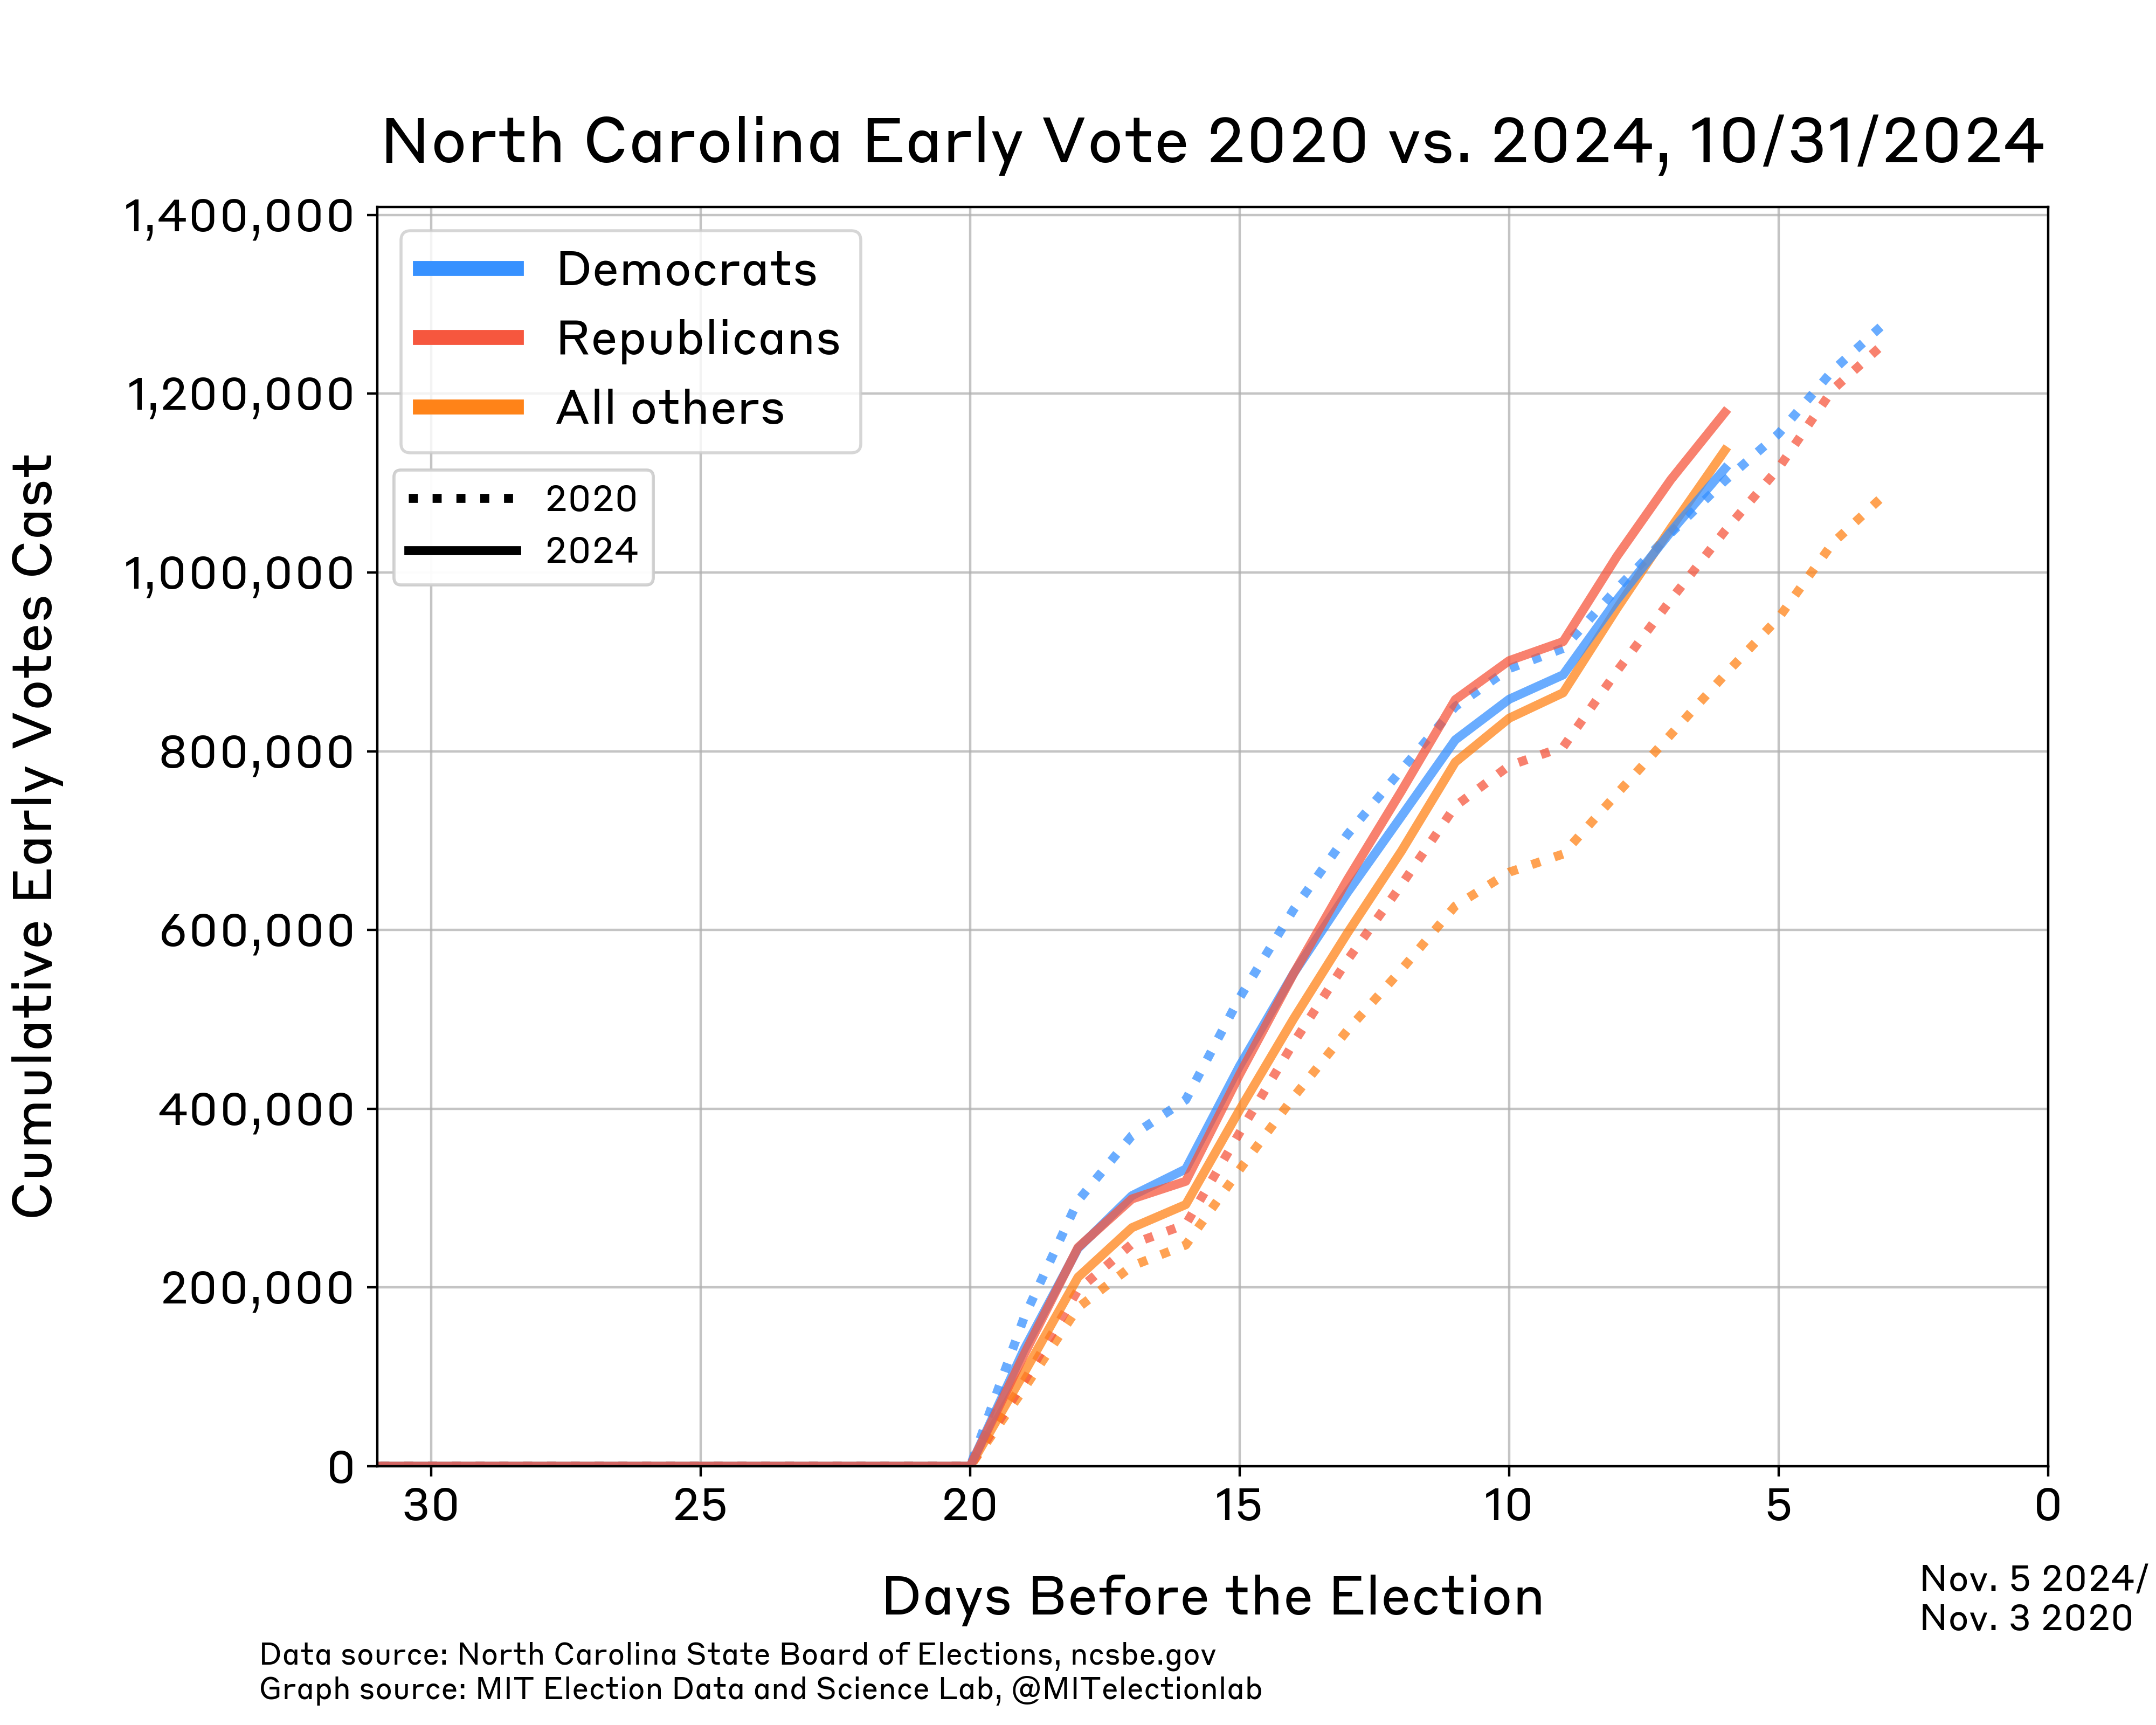
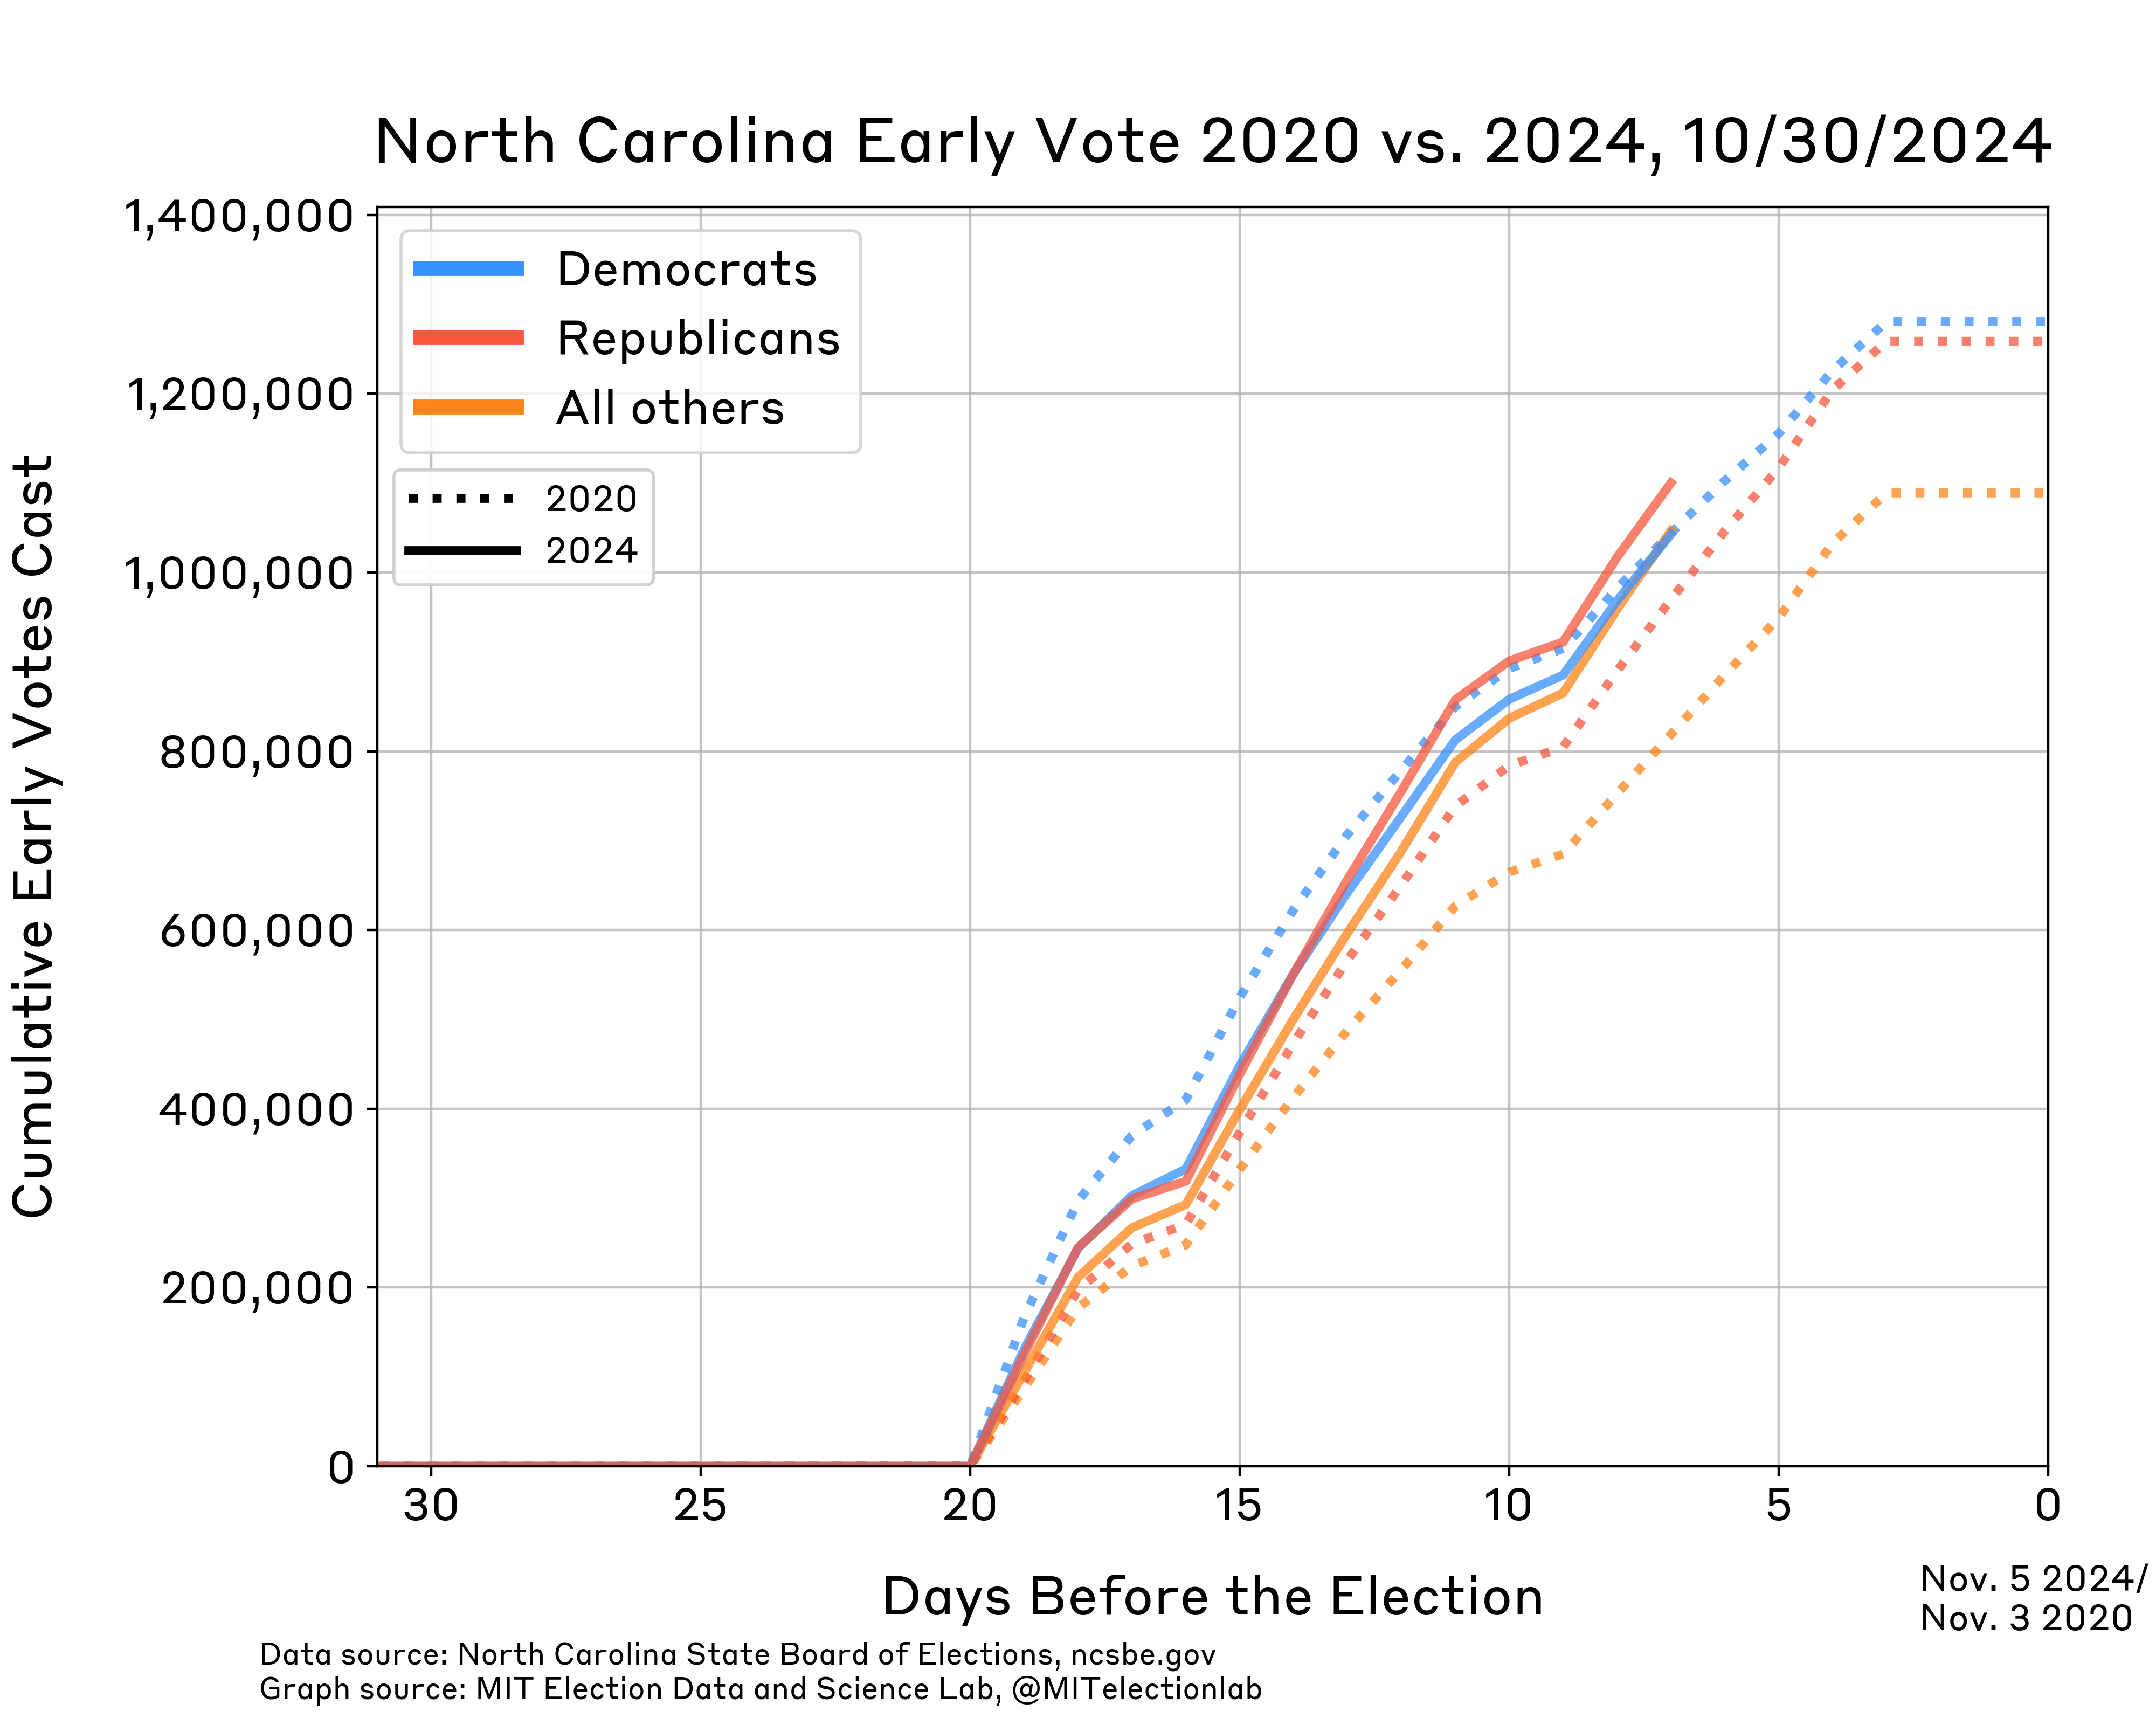
Early Voting
Last updated November 4, 2024
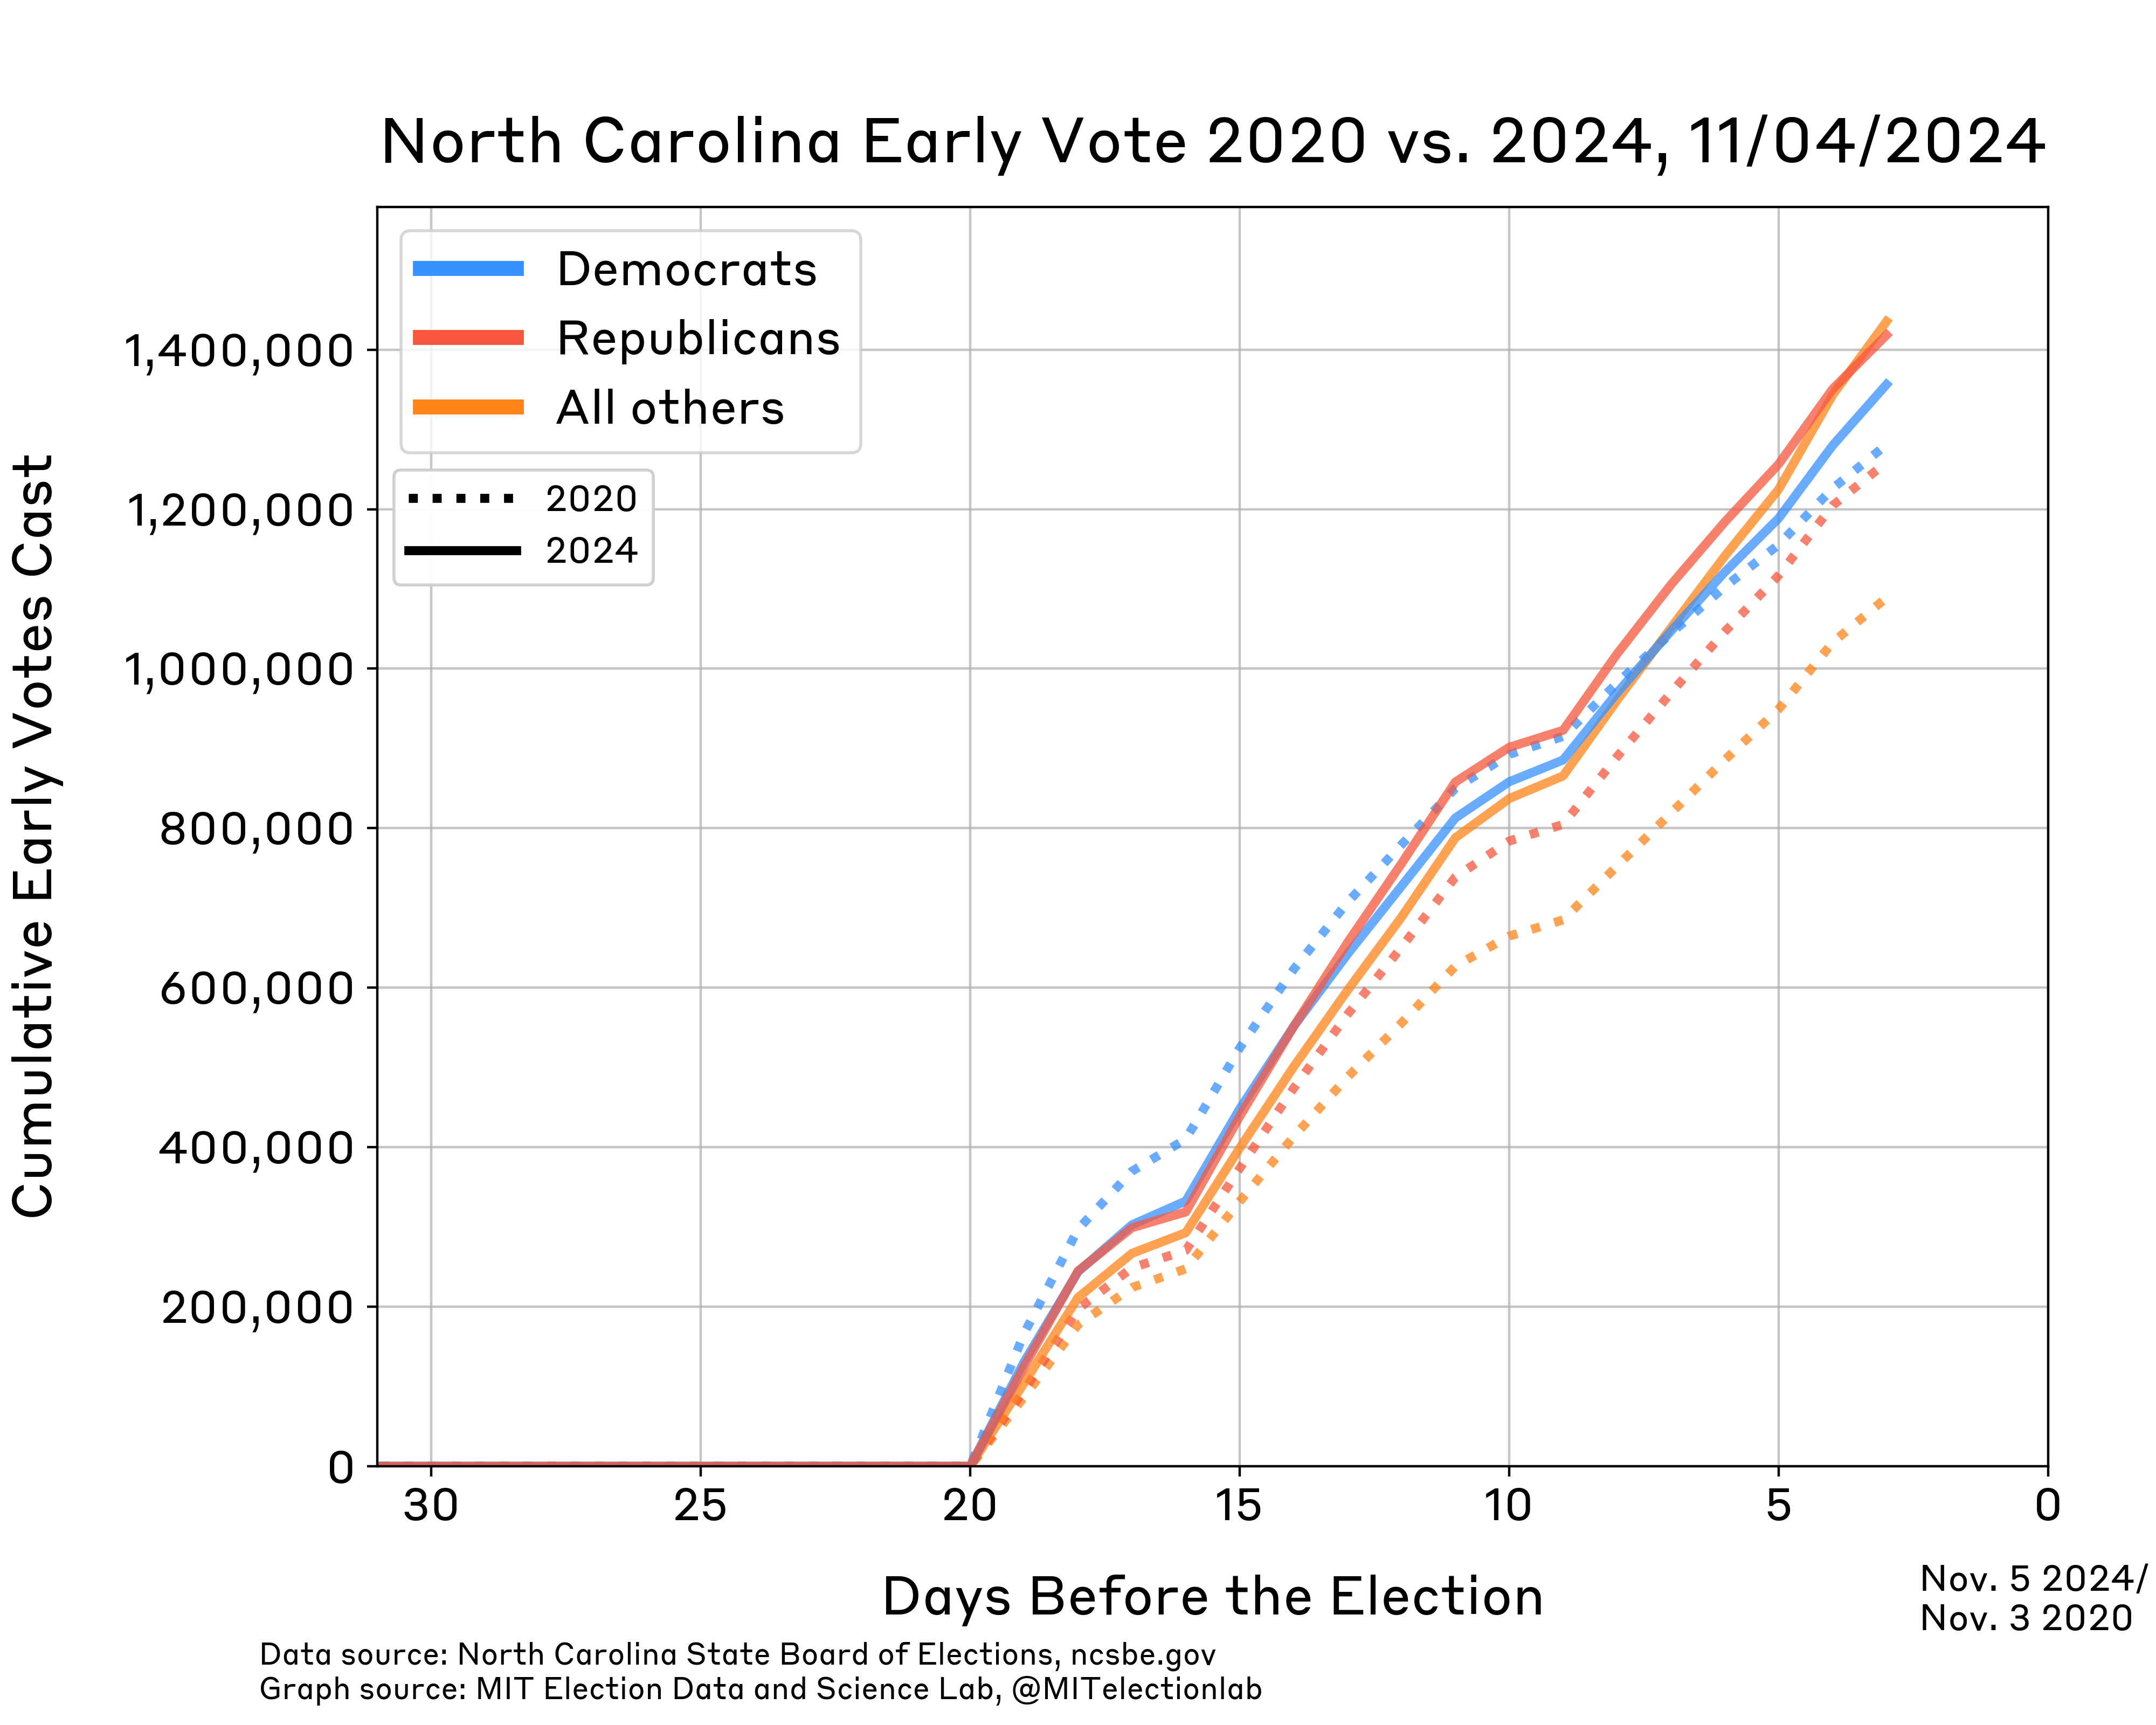
November 1, 2024
October 31, 2024
October 30, 2024
October 29, 2024